Voice-over country? Okay, Boomer. How young viewers are disrupting the AVT landscape in Poland
Gabriela
Flis1, University of Warsaw
Agnieszka Szarkowska2, University of Warsaw
The Journal of Specialised Translation 42 (2024), 193-216
https://doi.org/10.26034/cm.jostrans.2024.5989

ABSTRACT
Poland, historically known as a stronghold of voice-over when it comes to audiovisual translation (AVT), as evidenced by opinion polls of the 1990s and early 2000s, underwent a substantial shift in its AVT landscape with the emergence of streaming services. This paradigm shift not only grants viewers the autonomy to choose what and when to watch, but also enables them to select their preferred AVT type, with many opting against voice-over. This study aims to provide empirical evidence confirming these evolving AVT preferences of Polish viewers. Conducting an online survey of nearly 1300 adult Poles, we explore their AVT preferences and viewing habits across cinemas, television, and streaming platforms. Additionally, we investigate potential genre-related variations in AVT preferences, specifically comparing preferences for dubbing in animation versus live-action content. Our findings show a departure from the traditional preference towards voice-over towards subtitling, particularly prominent among millennials and Generation Z. Young Polish viewers are also increasingly drawn to VOD platforms and away from traditional linear TV broadcasts. Many viewers also express a notable fondness for dubbing in animated productions, especially those nostalgically remembered from childhood.
KEYWORDS
Audiovisual translation, dubbing, voice-over, viewers’ preferences, opinion poll, Poland.
1. Introduction
It is a cold November night, Friday afternoon. You just got home from a long day at work, your coat dripping with icy drizzle. Finally, the warmth of your home. Your phone lights up with a text from a friend, inviting you to an evening out. A nice dinner, maybe a drink or two to unwind after a week of hard work. It would be nice to see your friends, especially now that life has finally got back to normal after two years of intermittent lockdowns and Covid restrictions. Unconsciously, you wander into the bedroom. You type in “Rain check” and press send before slipping into the homely abyss. What a relief to be able to spend the night at home with a takeout, a nice glass of wine and, of course, a film. Or an episode (more likely episodes) of your favourite series.
Chances are that while reading the last part of the passage above, the idea of indulging in Netflix or another streaming platform crossed your mind. According to the prevailing consensus established over a quarter of a century ago, as described by Gottlieb (1998), if you happen to be Polish, it is highly probable that you would opt for watching something with voice-over (VO), arguably the most infamous mode of audiovisual translation (AVT). However, the entrenched beliefs about the AVT landscape in Poland, and possibly in other countries as well, no longer seem to align with the current reality, especially when it comes to younger demographics like Gen Zs and millennials. Given that the existing opinion polls and studies were conducted prior to the surge of video-on-demand (VOD) streaming services, which we deem to be the driving force behind the swift shift in viewers’ preferences, they now appear outdated and call for further research.
In this paper, we present the results of a recent study that explores the current preferences of Polish viewers regarding different types of audiovisual translation. We not only reveal significant shifts in AVT preferences, but also highlight how viewers’ preferences are largely divided by generational lines.
2. Changing AVT landscape
The traditional way of thinking about AVT preferences is based on country lines, associating preferences for AVT types with countries of residence (Chaume, 2012; Danan, 1991). This perspective was aptly summarised by Gottlieb (1998, p. 244), who categorised the world into four groups: (1) source-language countries, (2) dubbing countries, (3) voice-over countries and (4) subtitling countries. Source-language countries referred to English-speaking nations where non-English imports were scarce, and most audiovisual content was in English. Dubbing countries encompassed French, Italian, German and Spanish-speaking countries, often referred to as the FIGS group. According to Gottlieb (1998), voice-over countries included Russia, Poland and “other large or medium-sized speech communities which cannot afford lipsynch dubbing” (1998, p. 244). Lastly, subtitling countries included “several non-European speech communities as well as a number of small European countries with a high literate rate, where subtitling is preferred to dubbing” (Gottlieb, 1998, p. 244).
On his part, Chaume (2012, p. 6) outlined a similar “map” of the European AVT landscape:
“Dubbing countries: Austria, France, Germany, Hungary, Italy, Czech Republic, Slovakia, Spain, Turkey, and Ukraine.
Subtitling countries: Albania, Croatia, Cyprus, Denmark, Finland, Greece, Iceland, Ireland, the Netherlands, Norway, Portugal, Romania Serbia, Slovenia, Sweden, United Kingdom, among many others.
Voice-over countries: Poland (TV), Russia, Bulgaria, Latvia and Lithuania.
Dubbing and subtitling countries (countries that use both AVT modes): Belgium (dubbing in Wallonia and subtitling in Flanders), or Bulgaria (TV series are dubbed, whereas films are usually subtitled and some other programmes are voiced-over by at least four actors).”
Chaume’s map differs from Gottlieb’s by not including “source-language countries” as a separate category, and labelling the UK as a subtitling country. Chaume (2012, p. 6-7) acknowledges the distinction between dubbing and subtitling countries in his book, but he criticises this classification and calls it “rather simplistic”, “outdated” and “based on clichés”. While this classification may have accurately reflected the AVT landscape of the 1990s, it is essential to reassess and update this viewpoint in light of significant technological advancements and societal changes that have occurred since then.
Many of us still tend to think of countries based on their “preferred” mode of audiovisual translation. However, the AVT landscape in various countries, including our main focus, Poland, has undergone rapid transformations with the rise of popular VOD platforms such as Netflix, Amazon Prime, Disney+, or HBO Max. These platforms not only offer viewers extensive content libraries and freedom of choice, but also introduce a new dimension to AVT preferences. Unlike in the past, where viewers were limited to audiovisual translation modes on linear TV, in cinemas, or through video rentals, the emergence of VOD platforms has given users the unprecedented ability to choose how they want to watch, offering options like closed captions/subtitles for the deaf and hard of hearing (SDH), standard interlingual subtitles, dubbing, and voice-over, often available in multiple languages beyond their native tongue.
In addition to offering a broader range of AVT options, streaming platforms like Netflix have played a pivotal role in elevating the prominence of non-English content. This transformative shift has led to a landscape “whereby content in languages such as Spanish, Korean or Turkish, to name but a few, is now mainstreamed alongside English-language originals” (Díaz-Cintas & Hayes, 2023, p. 3). In this context, Díaz-Cintas and Hayes (2023, p. 3) talk about role reversal and inverting “the Anglocentric lens through which English is customarily viewed as the source or original language”. Consequently, Gottlieb’s categorisation of English-speaking countries as the exclusive source-language countries is gradually becoming obsolete. Similarly, with the wider availability and changing preferences of AVT modes among individual viewers, the categorisation of countries based on their preferred AVT mode, as outlined by Gottlieb (1998) and previously reiterated by AVT researchers (Díaz‐Cintas ,1999; Flis, Sikorski, & Szarkowska, 2020; Pérez-González, 2018; Szarkowska, 2009), is becoming outdated. This realisation necessitates a re-evaluation of the current AVT landscape.
3. The growing popularity of subtitling
Apart from the abovementioned shift in the wider availability of AVT options, another growing trend, especially among young people now, regardless of their hearing ability, is to watch content with captions3. According to recent research by Stagetext, as reported by the BBC, “young people are almost four times more likely than older viewers to watch TV shows with subtitles” (Youngs, 2021). Surprisingly, 45% of respondents aged 18-25 even expressed a greater likelihood of attending live events if captions were provided, as it helped them better understand what was happening. Conversely, older participants mentioned that subtitles required more focus and found them somewhat distracting.
One reason for this phenomenon could be attributed to the fact that younger individuals are generally more accustomed to reading subtitles on various screens, including smartphones. In fact, data from Facebook suggests that as early as 2016, up to 85% of short-form video content was viewed on mute (Patel, 2016), a figure that likely increased with the introduction of platforms like TikTok and the overall digital shift following the pandemic. Similar findings were reported in 2019 by Verizon Media and Publicis Media, who conducted research involving 5616 U.S. adults aged 18 to 54. Their study revealed that 69% of people watch content on mute when in public spaces, and 25% continue to do so even in the privacy of their own homes. Additionally, 80% of caption users in the same study were found to have no hearing difficulties, with an equal percentage stating that they were more likely to watch an entire video if captions were available (Dreier, 2019).
On the other hand, a recent survey conducted by Preply with over 1200 American respondents found that around 55% of participants agreed that understanding film dialogues has become more challenging. 72% mentioned that the audio tends to be unclear, which prompts them to watch content with subtitles (Zajechowski, 2022)4. Similarly, 74% participants indicated that subtitles assist them in comprehending the plot. Regarding audiovisual translation, an equal percentage of Americans (74%) expressed a preference for subtitling when consuming content in a non-native language. Furthermore, in line with the earlier discussion linking shifts in AVT preferences to the growing popularity of VOD services, the survey revealed that 62% of respondents use subtitles more frequently on streaming platforms compared to traditional television.
4. Audiovisual translation in Poland
While Poland is still widely regarded as a bastion of voice-over (Gottlieb, 1998; Garcarz 2007), it is worth noting that voice-over was not the initial method employed for translating foreign films in the country. In fact, Poland has a long-standing tradition of dubbing and subtitling, dating back to the late 1920s (Dolny, 2009; Plewa, 2015), shortly after the premiere of the first talkie. Following a period of stagnation due to WWII, Polish dubbing experienced a flourishing period during the 1960s and 1970s, with the establishment of the Dubbing Department within the Polish Feature Film Company (Wytwórnia Filmów Fabularnych) in Łódź (Mijas, 2016). This era marked the golden age of Polish dubbing, with the studio primarily producing translations for both animated films aimed at children and feature films with human actors, albeit largely imported from the USSR and its satellite nations. On the other hand, subtitling has not been used on television, but has been the dominant AVT modality used in Polish cinemas to translate foreign-language content.
Voice-over emerged as a cost-effective and easier-to-produce alternative to dubbing in the 1960s, gradually becoming the default mode of audiovisual translation for television during the 1980s, primarily driven by economic constraints. Following the fall of the Berlin Wall and the subsequent collapse of the communist regime in Poland, an attempt was made (led by the French-owned Canal Plus) to reintroduce dubbing in productions targeted at adult audiences, such as non-animated films and series. However, this effort proved to be both artistically and commercially unsuccessful, solidifying Poland’s reputation as a voice-over country alongside several other Central European nations.
Although voice-over arguably remains the dominant AVT mode for television, it was almost never employed in cinemas, where Polish viewers are offered a choice between subtitling and dubbing, particularly for animated productions and live-action feature films tailored to a younger demographic. In the realm of video-on-demand streaming platforms operating in Poland, viewers are typically provided with the option of selecting between subtitles or voice-over/dubbing, depending on the nature of the production.
5. Study
5.1 Rationale
Based on conversations with students and audiovisual translation adepts, we realised that not many of them use voice-over out of their own volition and a lot of them do not even have cable, satellite or terrestrial TV subscriptions. Anecdotal evidence from our professional lives, however compelling, is insufficient to make generalisations about an entire population and their preferences. Regrettably, no current opinion polls exist that we could compare to verify our hypothesis about changing AVT preferences.
Bogucki (2004) cites research conducted in 2002 by SGM/KRC, indicating that 50.2% of Poles preferred voice-over as their audiovisual translation mode of choice, with dubbing following closely at 43.4%. In contrast, only 8.1% of respondents chose subtitling. Furthermore, when asked about the least favoured AVT mode, 72.1% of Poles pointed to subtitling. These findings align with a BBC study carried out during the brief availability of BBC Prime in Poland, where 52% of respondents indicated a preference for voice-over, with only 4.5% opting for subtitling. A slightly different outcome was reported in a study commissioned by the national Polish television TVP and conducted by TNS OBOP, in which 45% of respondents selected both voice-over and dubbing, while subtitling received only 4% of votes (Garcarz, 2007).
Although more recent studies have been conducted by individual researchers rather than prominent polling centres or broadcasters, each study faced its own limitations. In 2015, Szarkowska and Laskowska published a report involving 427 participants, of whom 238 individuals (56% of respondents) self-identified as deaf or hard of hearing. Overall, 86.42% of all participants, regardless of hearing status, preferred subtitling as their AVT mode of choice, while only 4.22% selected voice-over. (It is important to note that dubbing was not included as an option, limiting the ecological validity of the study.) However, since over half of the respondents identified as deaf or hard of hearing, the results may have been swayed. When considering the hearing participants separately, 77% chose subtitling, while the figure rose to 91.03% for hard of hearing participants and 95% for deaf participants.
Another study conducted in 2018 by Bogucki and Deckert faced a similar issue of an insufficient sample size and lack of representativeness. They examined 160 university students from three different departments (English Philology, Italian Philology, and Sociology). However, due to the specific demographics of the sample, with the majority falling below the age of 26, it is challenging to draw generalised conclusions for the wider population.
Considering the rapid growth of the AVT market, the emergence of VOD platforms, and recent technological advancements, these studies can be deemed either outdated or incomplete.
5.2 Method
5.2.1 Design
We created an online survey using Google Forms as the platform for distribution. The survey was designed in Polish5. It encompassed 17 close-ended questions, covering a range of topics including demographic information and audiovisual translation preferences across various media types. Additionally, one open-ended question was included at the conclusion, making the total number of questions 18. This open-ended question invited respondents to provide any additional comments or insights they wished to share.
The questionnaire (in the Polish original version and its English translation) and the dataset are available in an open repository (Flis & Szarkowska, 2024).
5.2.2 Means of distribution
The study was addressed to Polish native speakers and it was conducted entirely through online channels, utilising social media platforms and email distribution for questionnaire dissemination. Our outreach efforts aimed to engage participants from diverse age groups. However, it is important to acknowledge that the chosen distribution method may have resulted in limited participation from elderly individuals. To mitigate this potential bias, we attempted to reach out to senior centres, but unfortunately encountered challenges and received a minimal response.
5.2.3 Participants
We gathered 1293 responses in total. After deleting data from underage participants and incorrectly completed questionnaires, the number of valid responses was 1291. Our participants were aged 18 to 76 (M = 27.64, SD = 9.7). 992 people (77.4%) of those identified as female, 269 (21%) as male, 5 (0.4%) indicated that they were non-binary, and 16 people (1.2%) stated they would rather not disclose their gender. Out of all the participants, 11 persons identified as deaf (0.9%).
Despite our efforts to employ diverse distribution methods, the online nature of the questionnaire led to a noticeable disparity in responses from elderly individuals. The majority of our participants, 85%, were younger than 36 years old. Among them, the largest group comprised individuals aged 18 to 25, accounting for 65% of all respondents (see Table 1).
| Generation | N | Percent |
| Gen Z (18-26) | 830 | 64.7% |
| Millennials (27-42) | 335 | 26.1% |
| Gen X (43-58) | 94 | 7.3% |
| Boomers (59-76) | 23 | 1.8% |
Table 1. Generational breakdown within the study
To better understand and gauge differences in AVT preferences between respondents of different ages, we categorised our participants into four generations:
Generation Z: This group consisted of individuals born between 1997 and 2003, ranging in age from 18 to 26. They constituted the largest segment, comprising 830 respondents, or 64.7% of the total sample.
Millennials: Encompassing those born between 1981 and 1996, aged 27 to 42, this group comprised 335 participants, representing 26.1% of the total.
Generation X: Comprising 94 individuals born between 1965 and 1980, aged 43 to 58, this group accounted for 7.3% of the sample.
Baby boomers: With eleven participants born from 1946 to 1964, aged 59 to 76, this group constituted 1.8% of the total.
We acknowledge that our sample displays a bias toward younger generations, and thus, the findings of our study cannot be extrapolated to the entire population, particularly older generations.
The majority of our participants were residents of urban areas with a population exceeding 500,000 inhabitants (see Table 2). Conversely, only approximately one-tenth of the respondents lived in rural areas. Additionally, around one-fifth of the participants resided in towns with a population ranging from 50,000 to 500,000 inhabitants.
| City size | N | Percent |
| Rural area | 139 | 10.8% |
| Up to 50K inhabitants | 110 | 8.6% |
| 51-150K inhabitants | 93 | 7.3% |
| 151-500K inhabitants | 84 | 6.6% |
| Above 500K inhabitants | 856 | 66.8% |
Table 2. Participants’ place of residence
As shown in Table 3, in terms of educational background, only a small number of respondents indicated having primary, secondary, or vocational education. The majority of participants were either students or had obtained an undergraduate or postgraduate degree.
| Education | N | Percent |
| Primary | 4 | 0.3% |
| Secondary/Vocational | 73 | 5.7% |
| Student | 464 | 36.2% |
| BA | 288 | 22.5% |
| MA and above | 453 | 35.5% |
Table 3. Participants’ education
As shown in Table 4, most of the participants were hearing (99.1%), but also 11 Deaf people took part.
| Hearing status | N | Percent |
| Hearing | 1271 | 99.1% |
| Deaf | 11 | 0.99% |
Table 4. Hearing and deaf participants
In considering the characteristics of our sample, we acknowledge the overrepresentation of younger age groups and the potential bias towards individuals with higher educational attainment. These factors may raise concerns regarding the generalisability of our findings to the broader population. Nevertheless, we contend that this demographic holds interest and relevance in capturing the evolving dynamics of AVT preferences in the present context.
5.3 Results
5.3.1 General AVT preferences
When respondents were asked about their preferred mode of audiovisual translation (Which audiovisual translation mode do you like best?), the majority (79.6%) expressed a preference for subtitling (see Figure 1). This signifies a substantial increase of 882% compared to the 8.1% reported in the SGM/KRC 2002 research. Voice-over garnered the second highest number of votes, with 12.8%, while dubbing, contrary to previous studies, received the lowest preference, with only 7.6% of respondents selecting it.
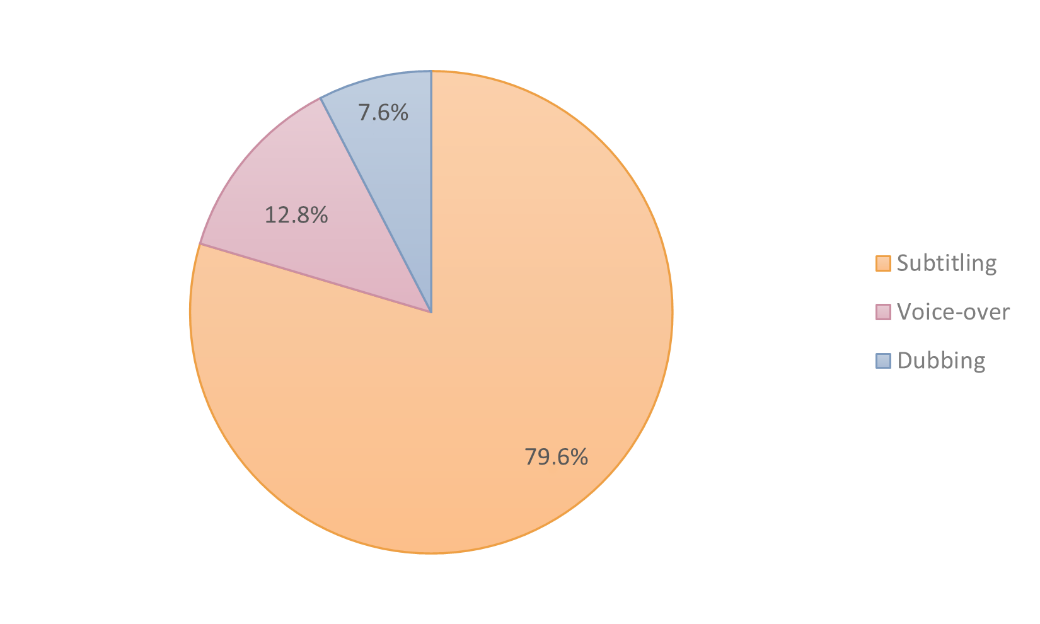
Figure 1. General AVT preferences
To gain more insight into participants’ preferences, we analysed the responses to the open-ended questions, using a thematic analysis framework (Braun & Clarke, 2006). One prevalent theme concerning AVT preferences revolved around the circumstances surrounding film viewing. As articulated by a respondent, “If I am focusing on the film, then I prefer subtitles [...]. If a film is a background for another activity (e.g., housework, simple computer work, casual discussions with friends), then [I prefer] voice-over.” This sentiment was echoed by another participant who stated, “Voice-over allows you to be a little less focused while watching (when watching a film with voice-over, we can sometimes do other things and not lose the plot).” Such statements indicate that while individuals may have an overall preference for a particular audiovisual translation mode, their preferences are fluid and contingent upon the purpose of engaging with the content.
Another factor that may influence an individual’s choice of AVT type is the presence of family members or friends. One respondent noted:
My preferences often involve whom I watch a film or TV series with. My husband has a poor knowledge of English and is a bit hard of hearing, so when we watch something together, we choose voice-over and sometimes additional subtitles.
Another participant added, “The choice between subtitles and voice-over is sometimes an issue of volume. I have a small child, so I often turn on the series with low volume and put on subtitles so as not to wake them.” Similarly, a third person expressed a similar sentiment, stating:
My parents (around 45 years old) always choose dubbing and voice-over because they have lesser knowledge of foreign languages, plus my mother finds reading subtitles very cumbersome (she says she gets tired). Therefore, when watching films and TV series with them, I choose voice-over.
To recap, our analysis of participants’ responses revealed that AVT preferences are fluid and context-dependent. The circumstances surrounding film viewing, including the level of focus or engagement and the presence of family members or friends with different language abilities or hearing impairments, can influence individuals’ preferences for subtitling or voice-over. These findings highlight the dynamic nature of AVT preferences, emphasising the importance of considering the purpose and social context of content consumption.
AVT preferences by generation
To examine the relationship between AVT preferences and participants’ age, we conducted a Pearson’s chi-square test. The results revealed a significant association between the two variables, χ2 (6, N = 1282) = 125.91, p < .001. This means that AVT preferences are related to a person’s age and the generation they belong to.
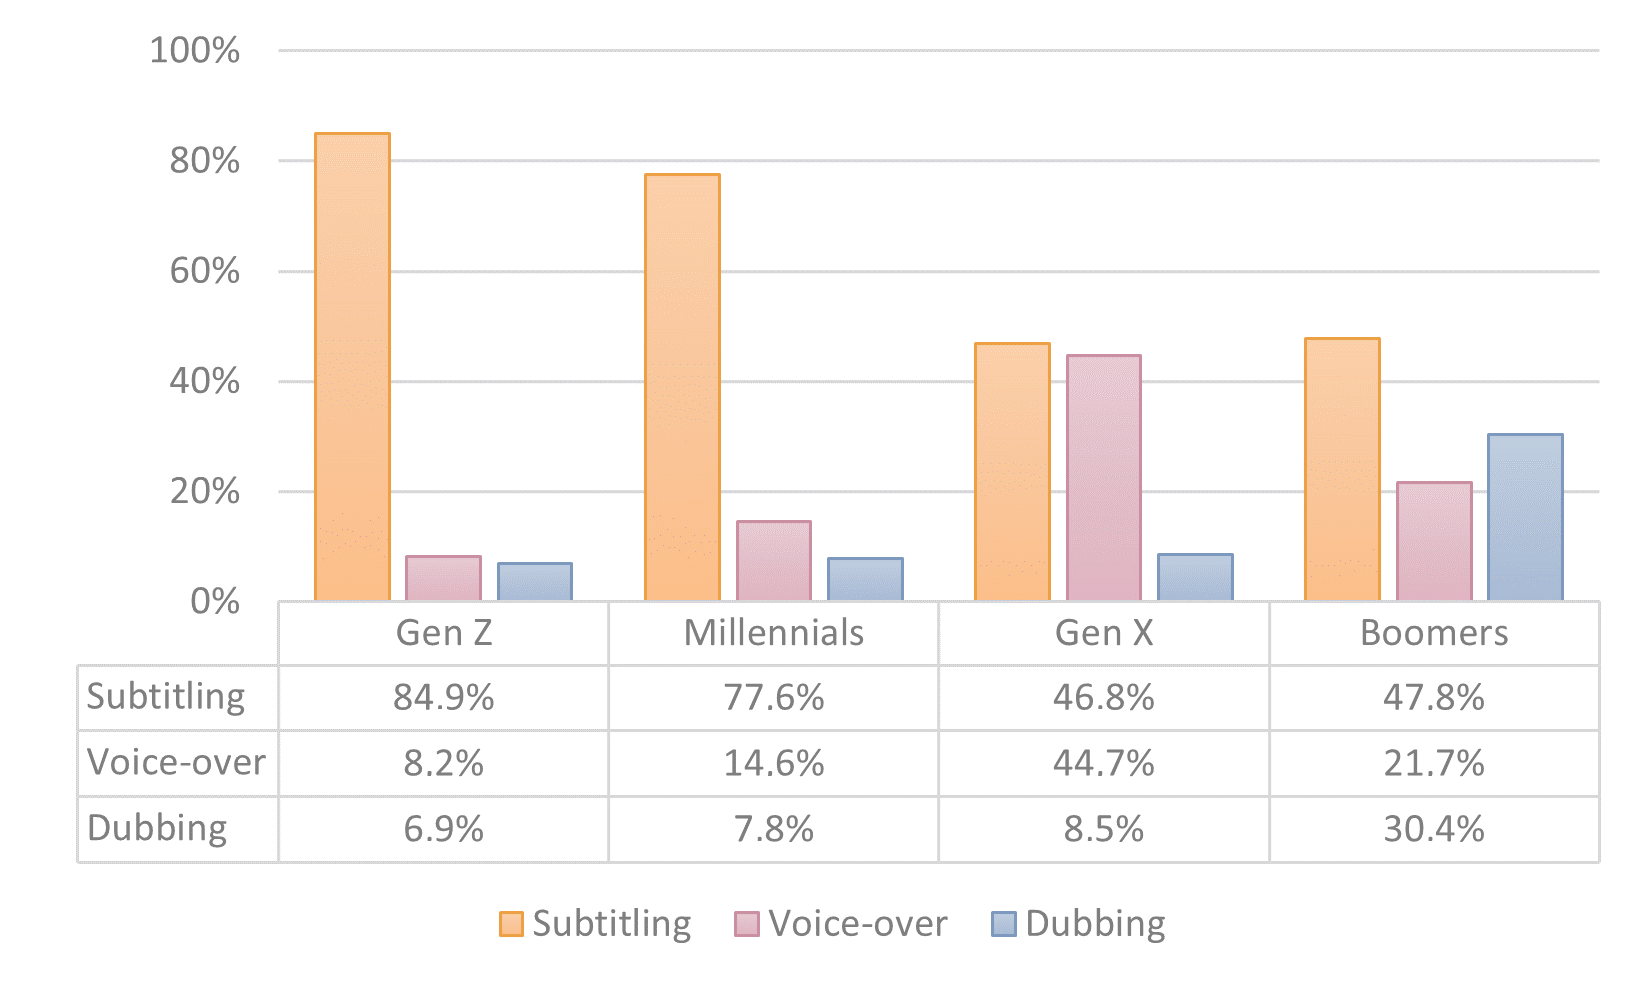
Figure 2. AVT preferences by generation
As depicted in Figure 2, subtitling emerged as the preferred AVT mode across all respondent groups. However, while younger generations showed a clear preference for subtitling, the oldest group displayed the highest preference for dubbing, and the Gen X group exhibited the highest preference for voice-over. This pattern may possibly be attributed to the baby boomers’ recollection of the excellent Polish dubbing available on TV during the 1960s and 1970s, which continues to shape their preference. The highest preference for voice-over in the Gen X group may be explained by the fact that they are too young to remember the golden times of Polish dubbing in the 1960s and 1970s (Polish Dubbing School), as they grew up hearing mostly voice-over on TV. Notably, Gen X participants displayed a more divided preference, with a nearly equal number favouring voice-over and subtitling. In contrast, the two youngest generations, millennials and Gen Zs, overwhelmingly expressed a preference for subtitling.
AVT preferences by education
To explore the relationship between AVT preferences and participants’ education, we conducted a Pearson’s chi-square test, revealing a significant association, χ2 (8, N = 1282) = 80.18, p < .001. Participants with secondary or vocational education were less likely to prefer subtitling compared to other groups. In contrast, students tended to favour subtitling over voice-over or dubbing.
AVT preferences by place of residence
To investigate the potential association between AVT preferences and participants’ place of residence, we conducted a Pearson’s chi-square test, revealing a significant relationship, χ2 (8, N = 1282) = 34.16, p < .001. Participants from rural areas were less likely to prefer subtitling. Individuals residing in rural areas and towns with populations up to 50,000 tended to lean towards dubbing as their preferred AVT mode. Conversely, respondents living in cities with populations exceeding 500,000 showed a tendency to favour subtitling over voice-over or dubbing.
In summary, there are notable differences in AVT preferences across generations, with younger generations showing a preference for subtitling, while dubbing and voice-over are more prominent among older generations (although in our study it is subtitling that transpired as the preferred AVT type across all generations). Additionally, educational background and place of residence can influence AVT preferences, although it is important to acknowledge that these factors may be confounded with generational differences, which appear to be the primary source of variation.
5.3.2 Viewing habits across generations
Expecting differences in media consumption across different generations and settings, we asked the participants how frequently they watched films and series on TV and on VOD platforms as well as in cinemas (in this case only for films, not series). Responses were measured on a seven-point scale, ranging from one (indicating “never”) to seven (indicating “always”).
To investigate the influence of age on participants’ viewing patterns, we conducted analyses of variance (ANOVA) with participant generation as a factor and the averaged frequency of viewing content in different settings as the dependent variable. We found that age was a significant predictor of viewing patterns across all settings (see Table 5), which we examine in greater detail below.
| Gen Z | Millennials | Gen X | Baby boomers | |||||||||
| M (SD) | M (SD) | M (SD) | M (SD) | df (error) | F | p | ηp2 | |||||
| I watch films in the cinema |
|
|
|
|
|
|
|
|
|
|
|
|
| I watch films on TV |
|
|
|
|
|
|
|
|
|
|
|
|
| I watch films on VOD |
|
|
|
|
|
|
|
|
|
|
|
|
| I watch TV series on TV |
|
|
|
|
|
|
|
|
|
|
|
|
| I watch TV series on VOD | 5.85 | (1.58) | 5.57 | (1.74) | 4.37 | (2.06) | 2.57 | (2.31) | 3,1278 | 47.870 | <.001 | .101 |
Table 5. Viewing patterns by generation
Watching films in cinemas
In terms of going to the cinema, the overall mean was 3.01 (SD=1.23), indicating that people from all generations do not frequent cinemas very often. We observed a significant main effect of age on the frequency of going to the cinema, F(3, 1278)=2.841, p=.037. Post-hoc Bonferroni tests revealed a significant difference in cinema attendance between Gen X and Gen Z (p=.038), but not among the other groups. It is the two youngest generations with the highest mean (MGenZ=3.05 and Mmill=3.04) who attend cinemas most frequently, whereas Gen X had the lowest mean (MGenX =3.68) and was the least likely to visit cinemas.
To provide a visual representation of the distribution of responses for specific questions, we present the histograms (Fig. 3-6), illustrating the audiovisual content consumption patterns of different generations across various platforms. Fig. 3 illustrates the frequency of going to the cinema among different generations.
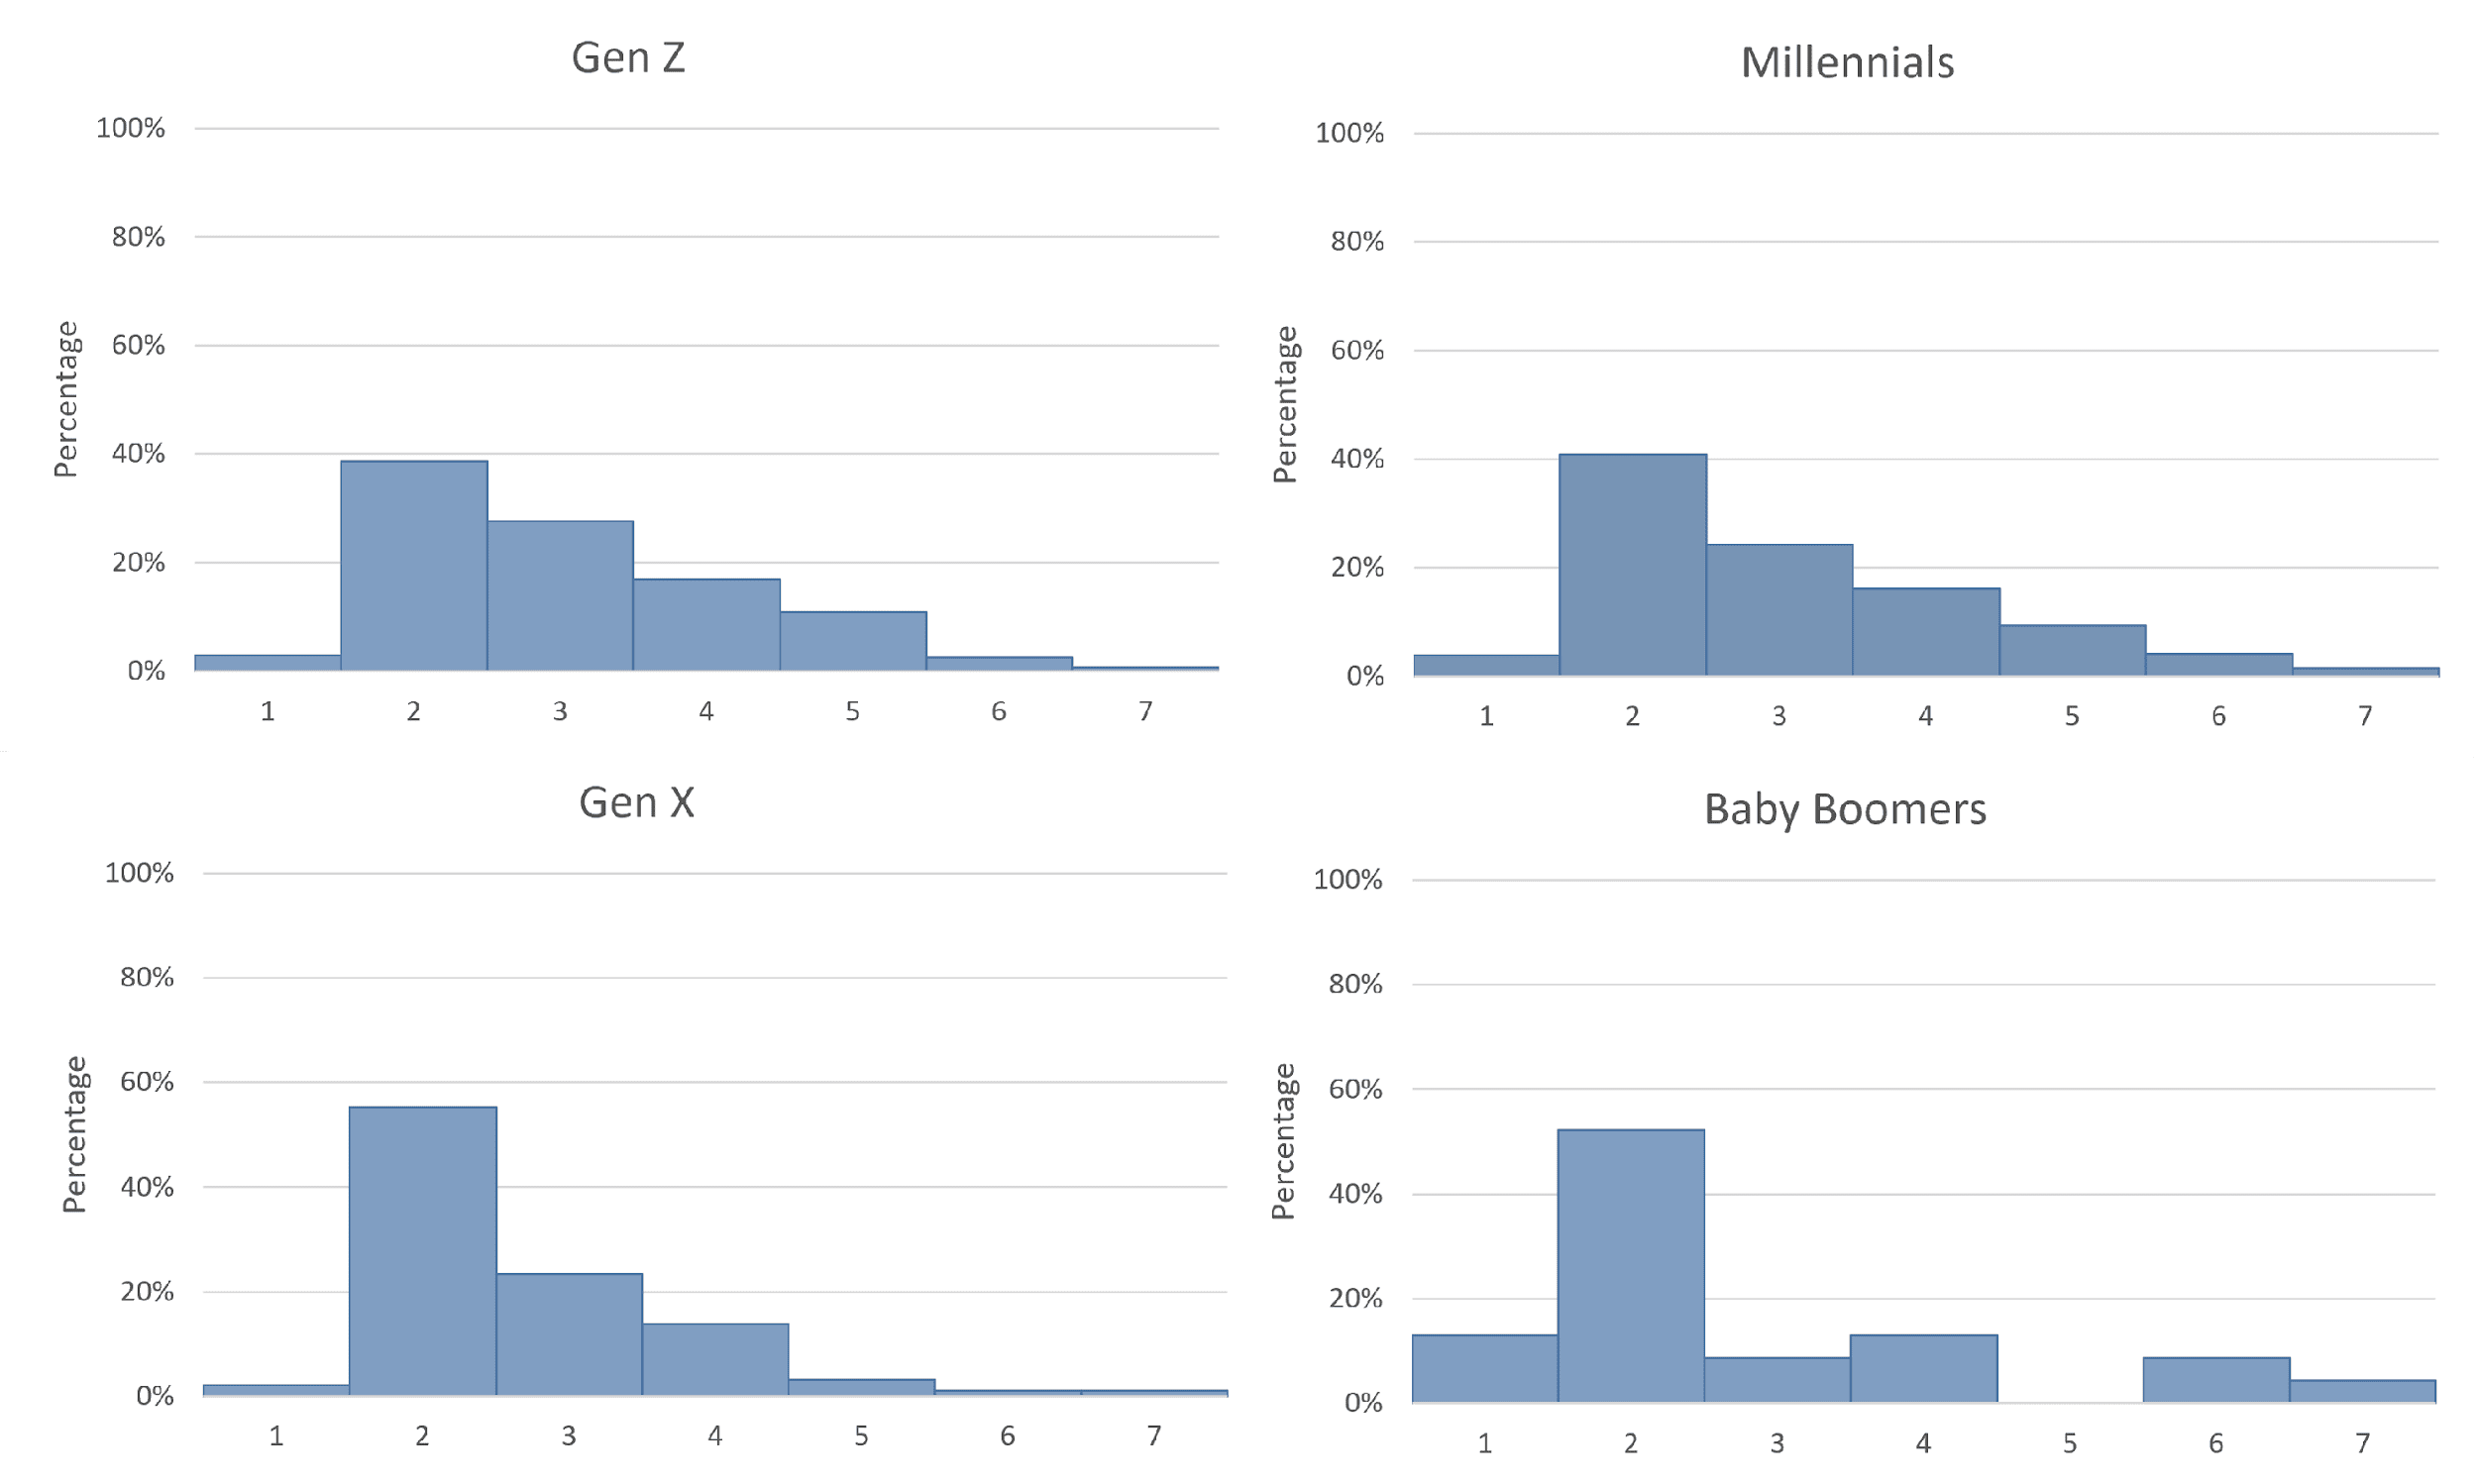
Figure 3. How often do you watch films in the cinema?
The low likelihood of going to the cinema could be attributed to two possible factors. Firstly, it might be a lingering effect of the post-pandemic situation, as cinemas in Poland were subject to prolonged closures during Covid-19 lockdowns. Consequently, viewers have become more accustomed to watching movie premieres on their laptops or other devices. Secondly, the availability of Oscar-winning films and acclaimed performances on VOD platforms shortly after, or even concurrently with, their theatrical release has made it possible for former moviegoers to enjoy these productions from the comfort of their own sofas, without the need to incur additional expenses. Finally, according to Jankowska (2019), Polish seniors are more likely to choose voice-over and dubbing as their preferred AVT mode and although the majority of the respondents claimed that the overarching popularity of subtitling in cinemas does not discourage them from going to movie theatres, simultaneously more than a half declared they had problems with reading the subtitles, which may explain some generational differences depicted on the graph above. What is more, accounts from elderly viewers gathered by Szkriba (2022) may further elucidate this tendency, with one participant echoing the results of Jankowska’s survey:
[i]n the summer, we have a big screen here, and we can watch films every week. (...) I specifically asked the organisers if the film would be displayed with subtitles or voice-over. (...) [If the film had been subtitled], I would still have gone to see it, but this way I could sit comfortably on a deckchair (...) and watch the film (p. 142).
Other participants admitted they find keeping up with the subtitles hard and tiresome, with one going as far as to state “[i]f I have to go to the cinema and read subtitles, then I would rather sit at home and read a book” (p. 142).
Watching films on TV
When it comes to watching films on traditional television, we observed a significant main effect of age, F(3, 1278)=15.531, p<.001. Post-hoc Bonferroni tests showed significant differences between Gen Z and millennials on the one hand, and Gen X and baby boomers on the other, with ps<.001. However, there were no significant differences between Gen Z and millennials (p=.059) or between Gen X and baby boomers (p=.762).
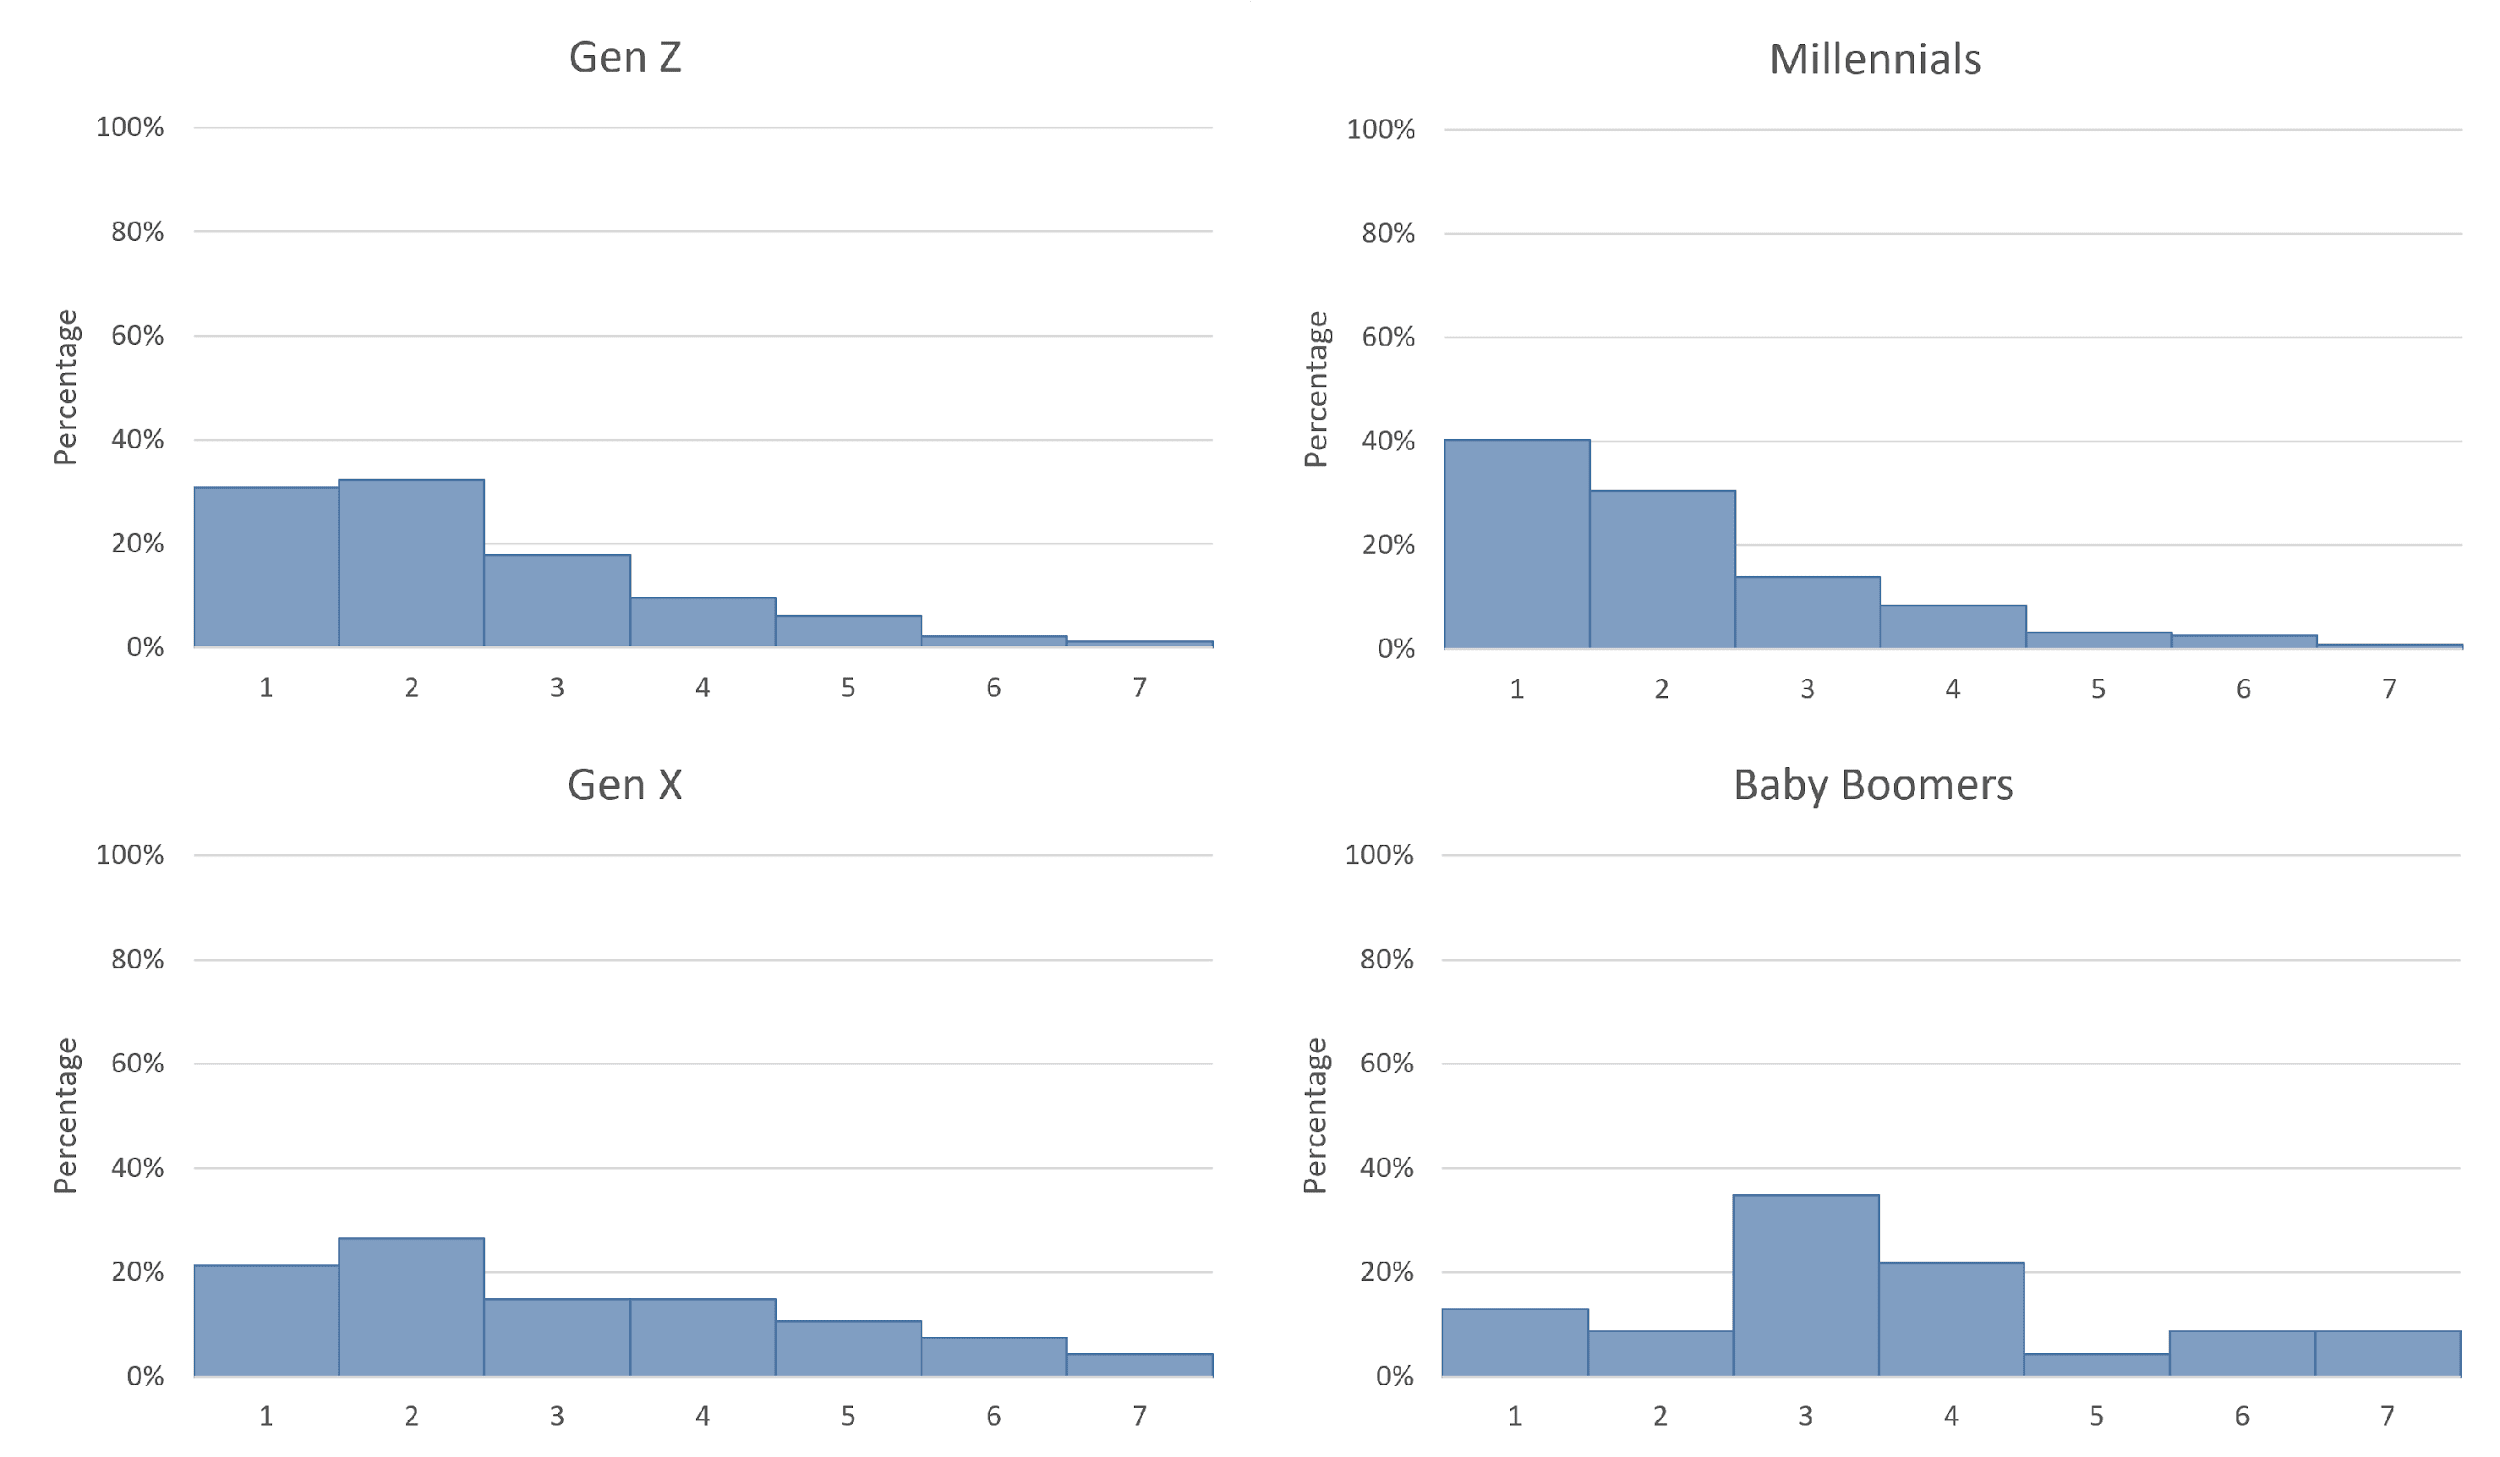
Figure 4. How often do you watch films on TV?
As illustrated in Fig. 4 and Table 5, Gen Z and millennials are considerably less likely to watch films on TV compared to older viewers. This aligns with the declining TV trend described in further sections.
Watching films on VOD
We also asked the participants about the frequency of watching films on VOD platforms (see Fig. 5). Once again, we found a significant main effect of age, F(3, 1278)=44.322, p<.001.
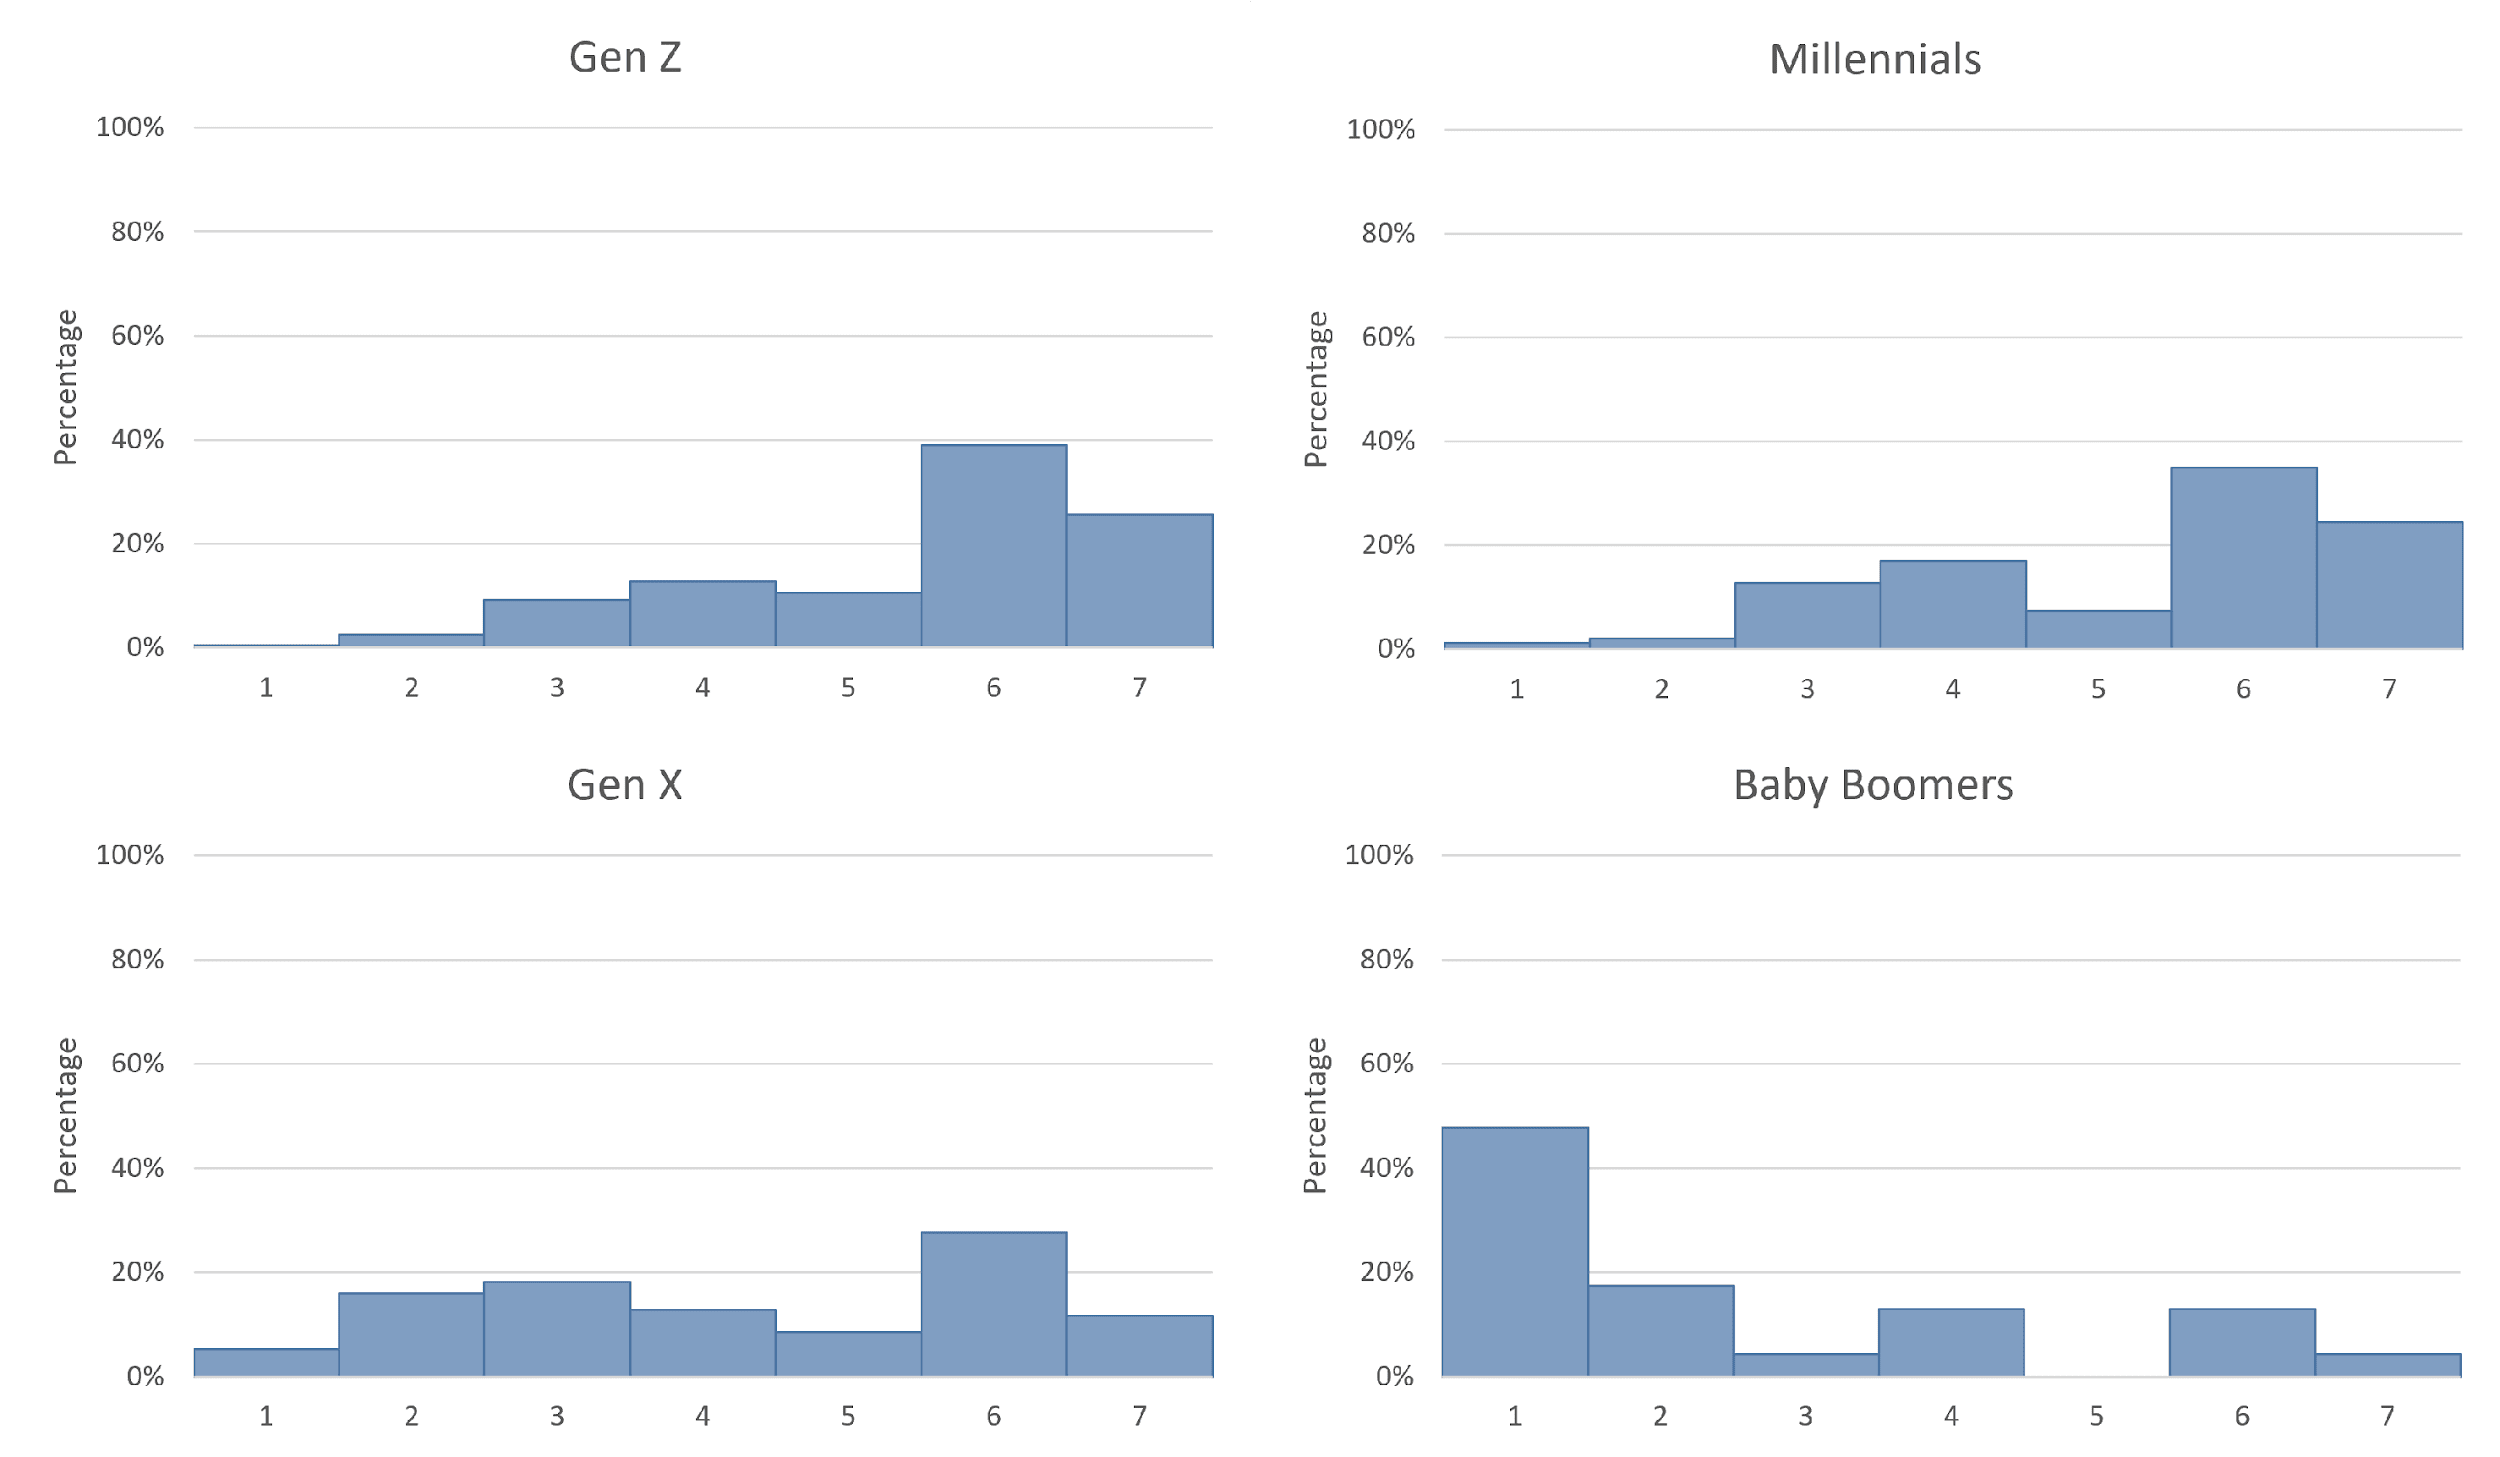
Figure 5. How often do you watch films on VOD?
Baby boomers reported rare usage of VOD platforms for film viewing (MBoomers= 2.57), while the other generations were much more likely to use this type of entertainment. While there was no difference between Gen X and millennials (MGenZ=5.50 and MMill=5.30, p=.248), Gen X and baby boomers differed from all the other groups. This suggests a significant generational disparity in the adoption and usage of VOD services for film consumption.
Watching series on TV
The last two questions in this section were related to watching series on TV and on streaming platforms.
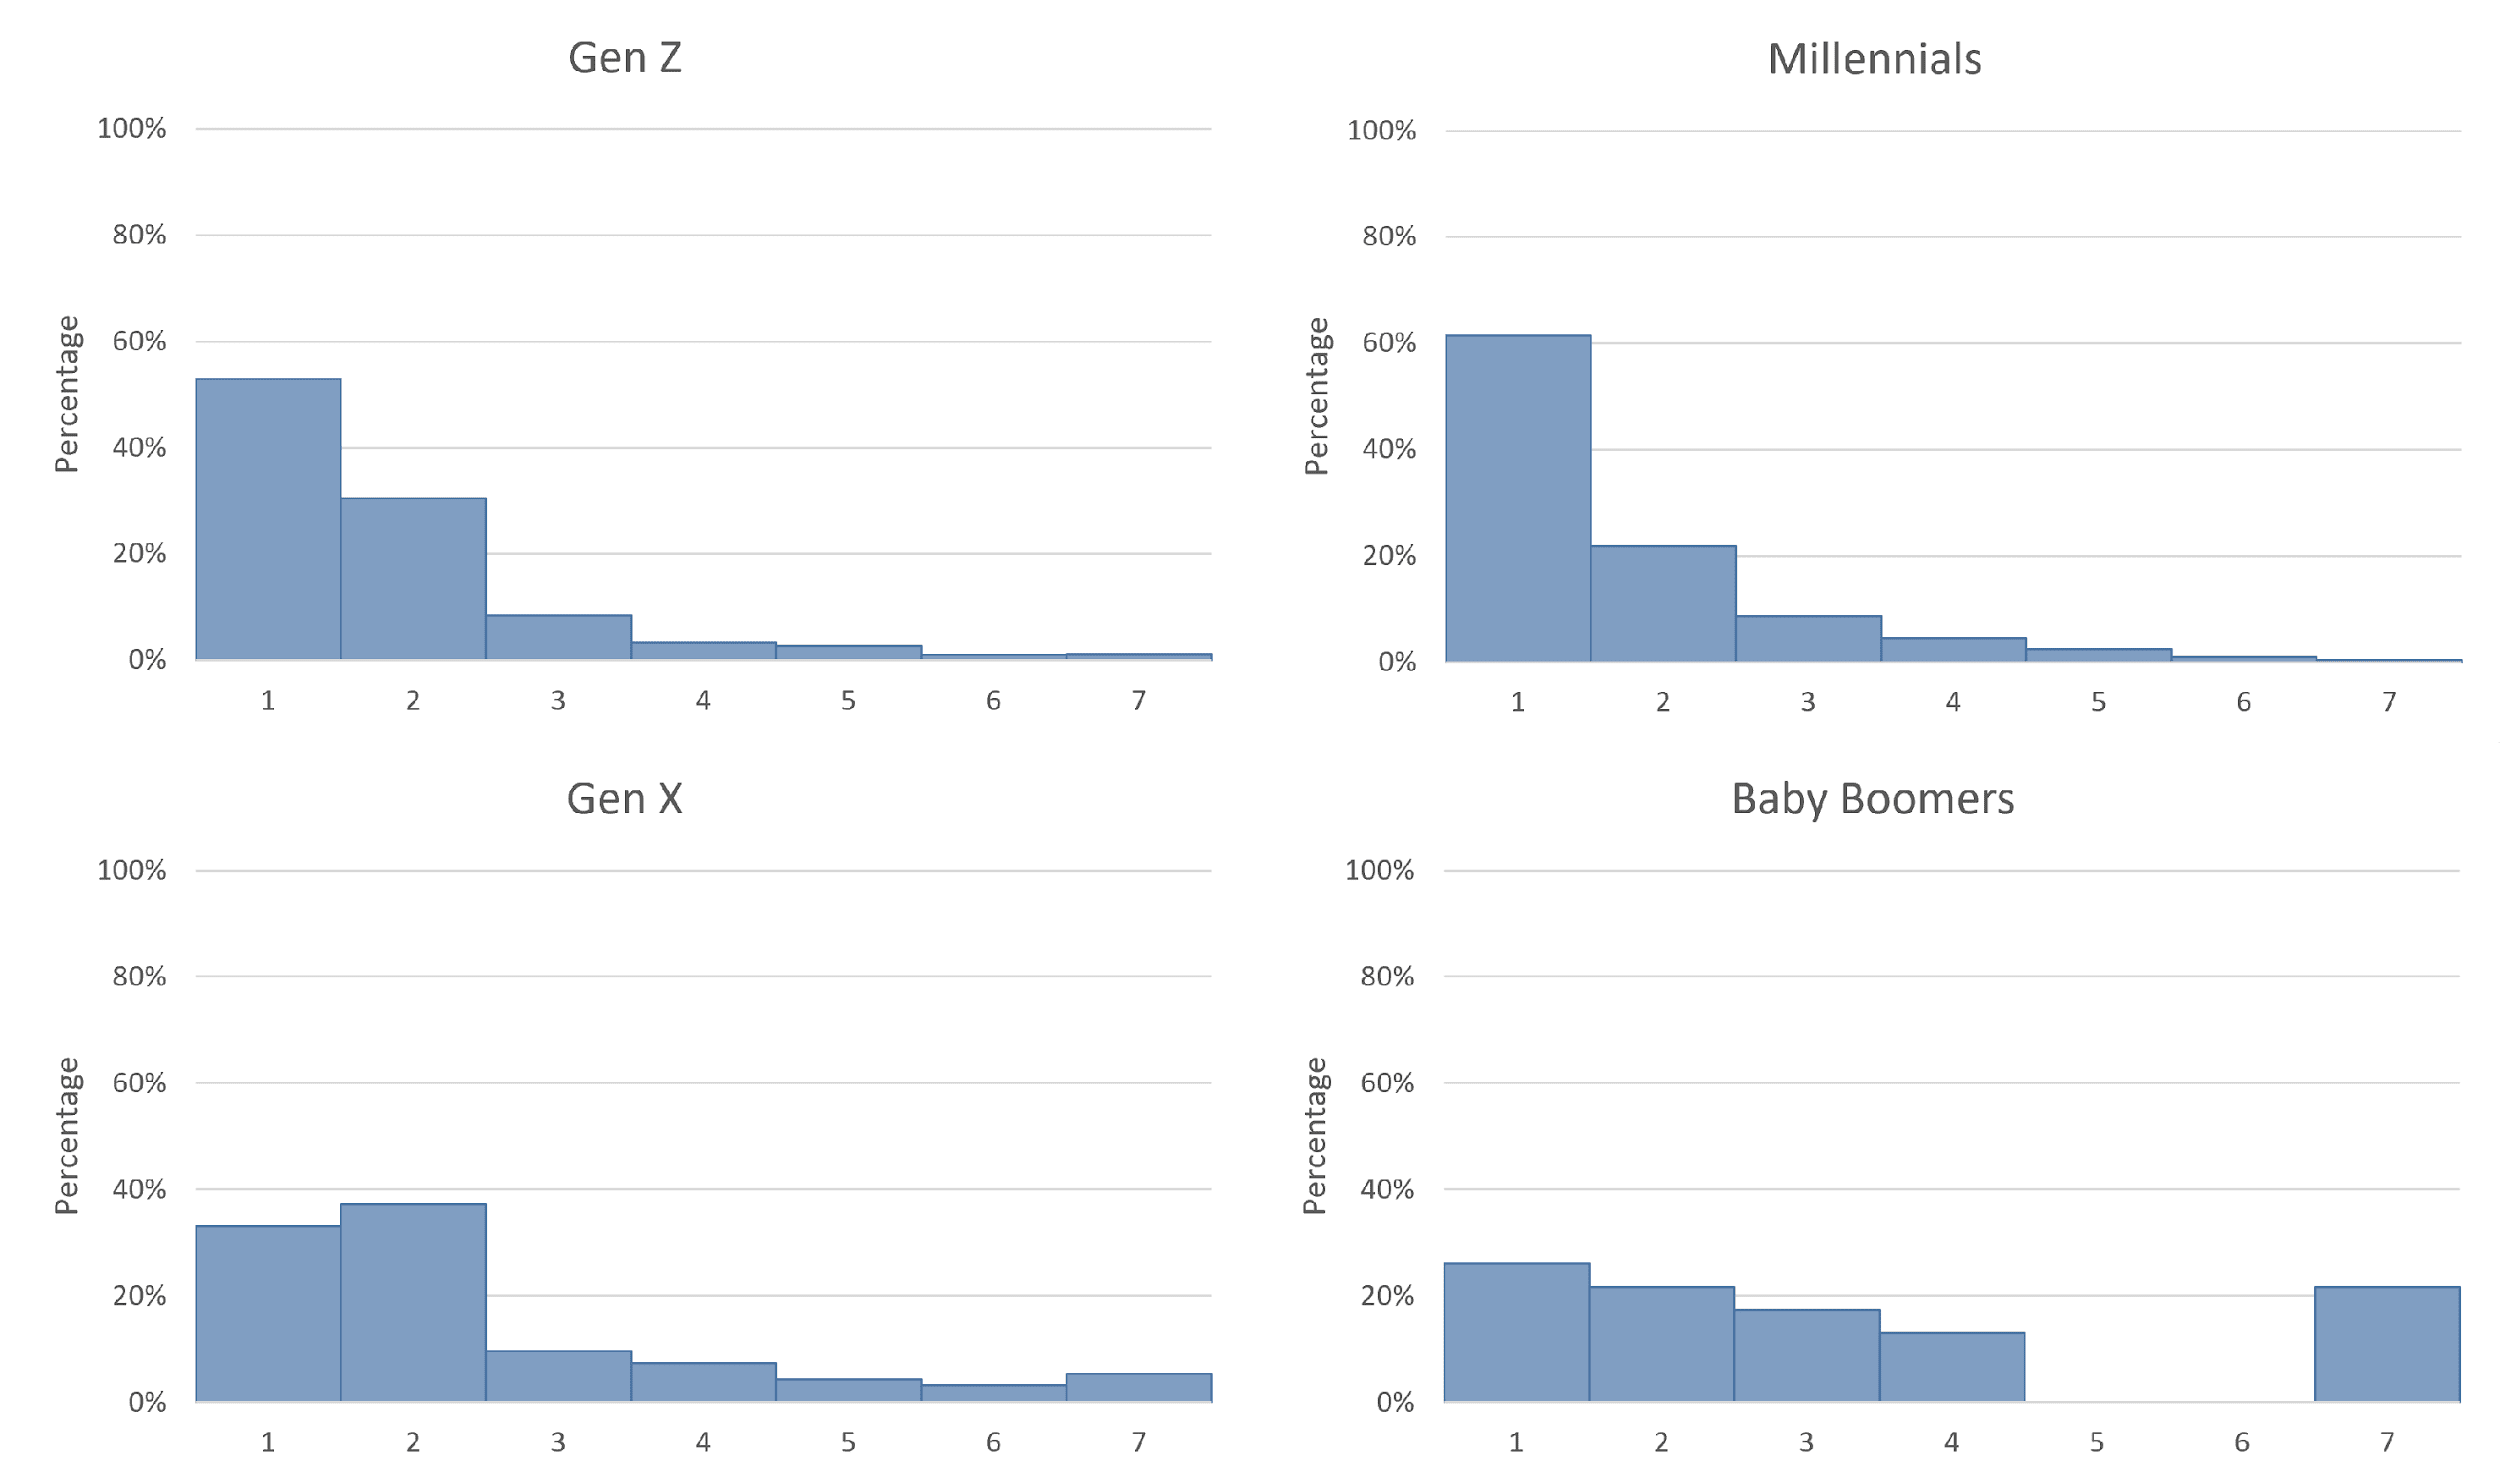
Figure 6. How often do you watch series on TV?
Similarly to the previous questions, we found a main effect of age on watching series on TV, F(3, 1278)=19.912, p<.001. Post-hoc Bonferroni tests showed that the differences were demarcated along generational lines: Gen Z and millennials declared not to watch series on TV very often (MGenZ=1.80 and Mmill=1.68) whereas baby boomers were the group that watched series on TV most often (MBoomers= 3.26) and significantly differed from the other groups in this respect.
Although younger generations may occasionally watch a film on TV (perhaps when visiting their family), they show a strong overall aversion to watching TV series on traditional linear television. Approximately 60% of millennials indicate that they never watch series on TV. This finding suggests a clear preference among younger viewers for alternative platforms or streaming services when it comes to consuming TV series.
Watching series on VOD
Finally, as regards watching series on streaming platforms, age once again emerged as a significant predictor of viewing patterns, F(3, 1278)=135.265, p<.001.
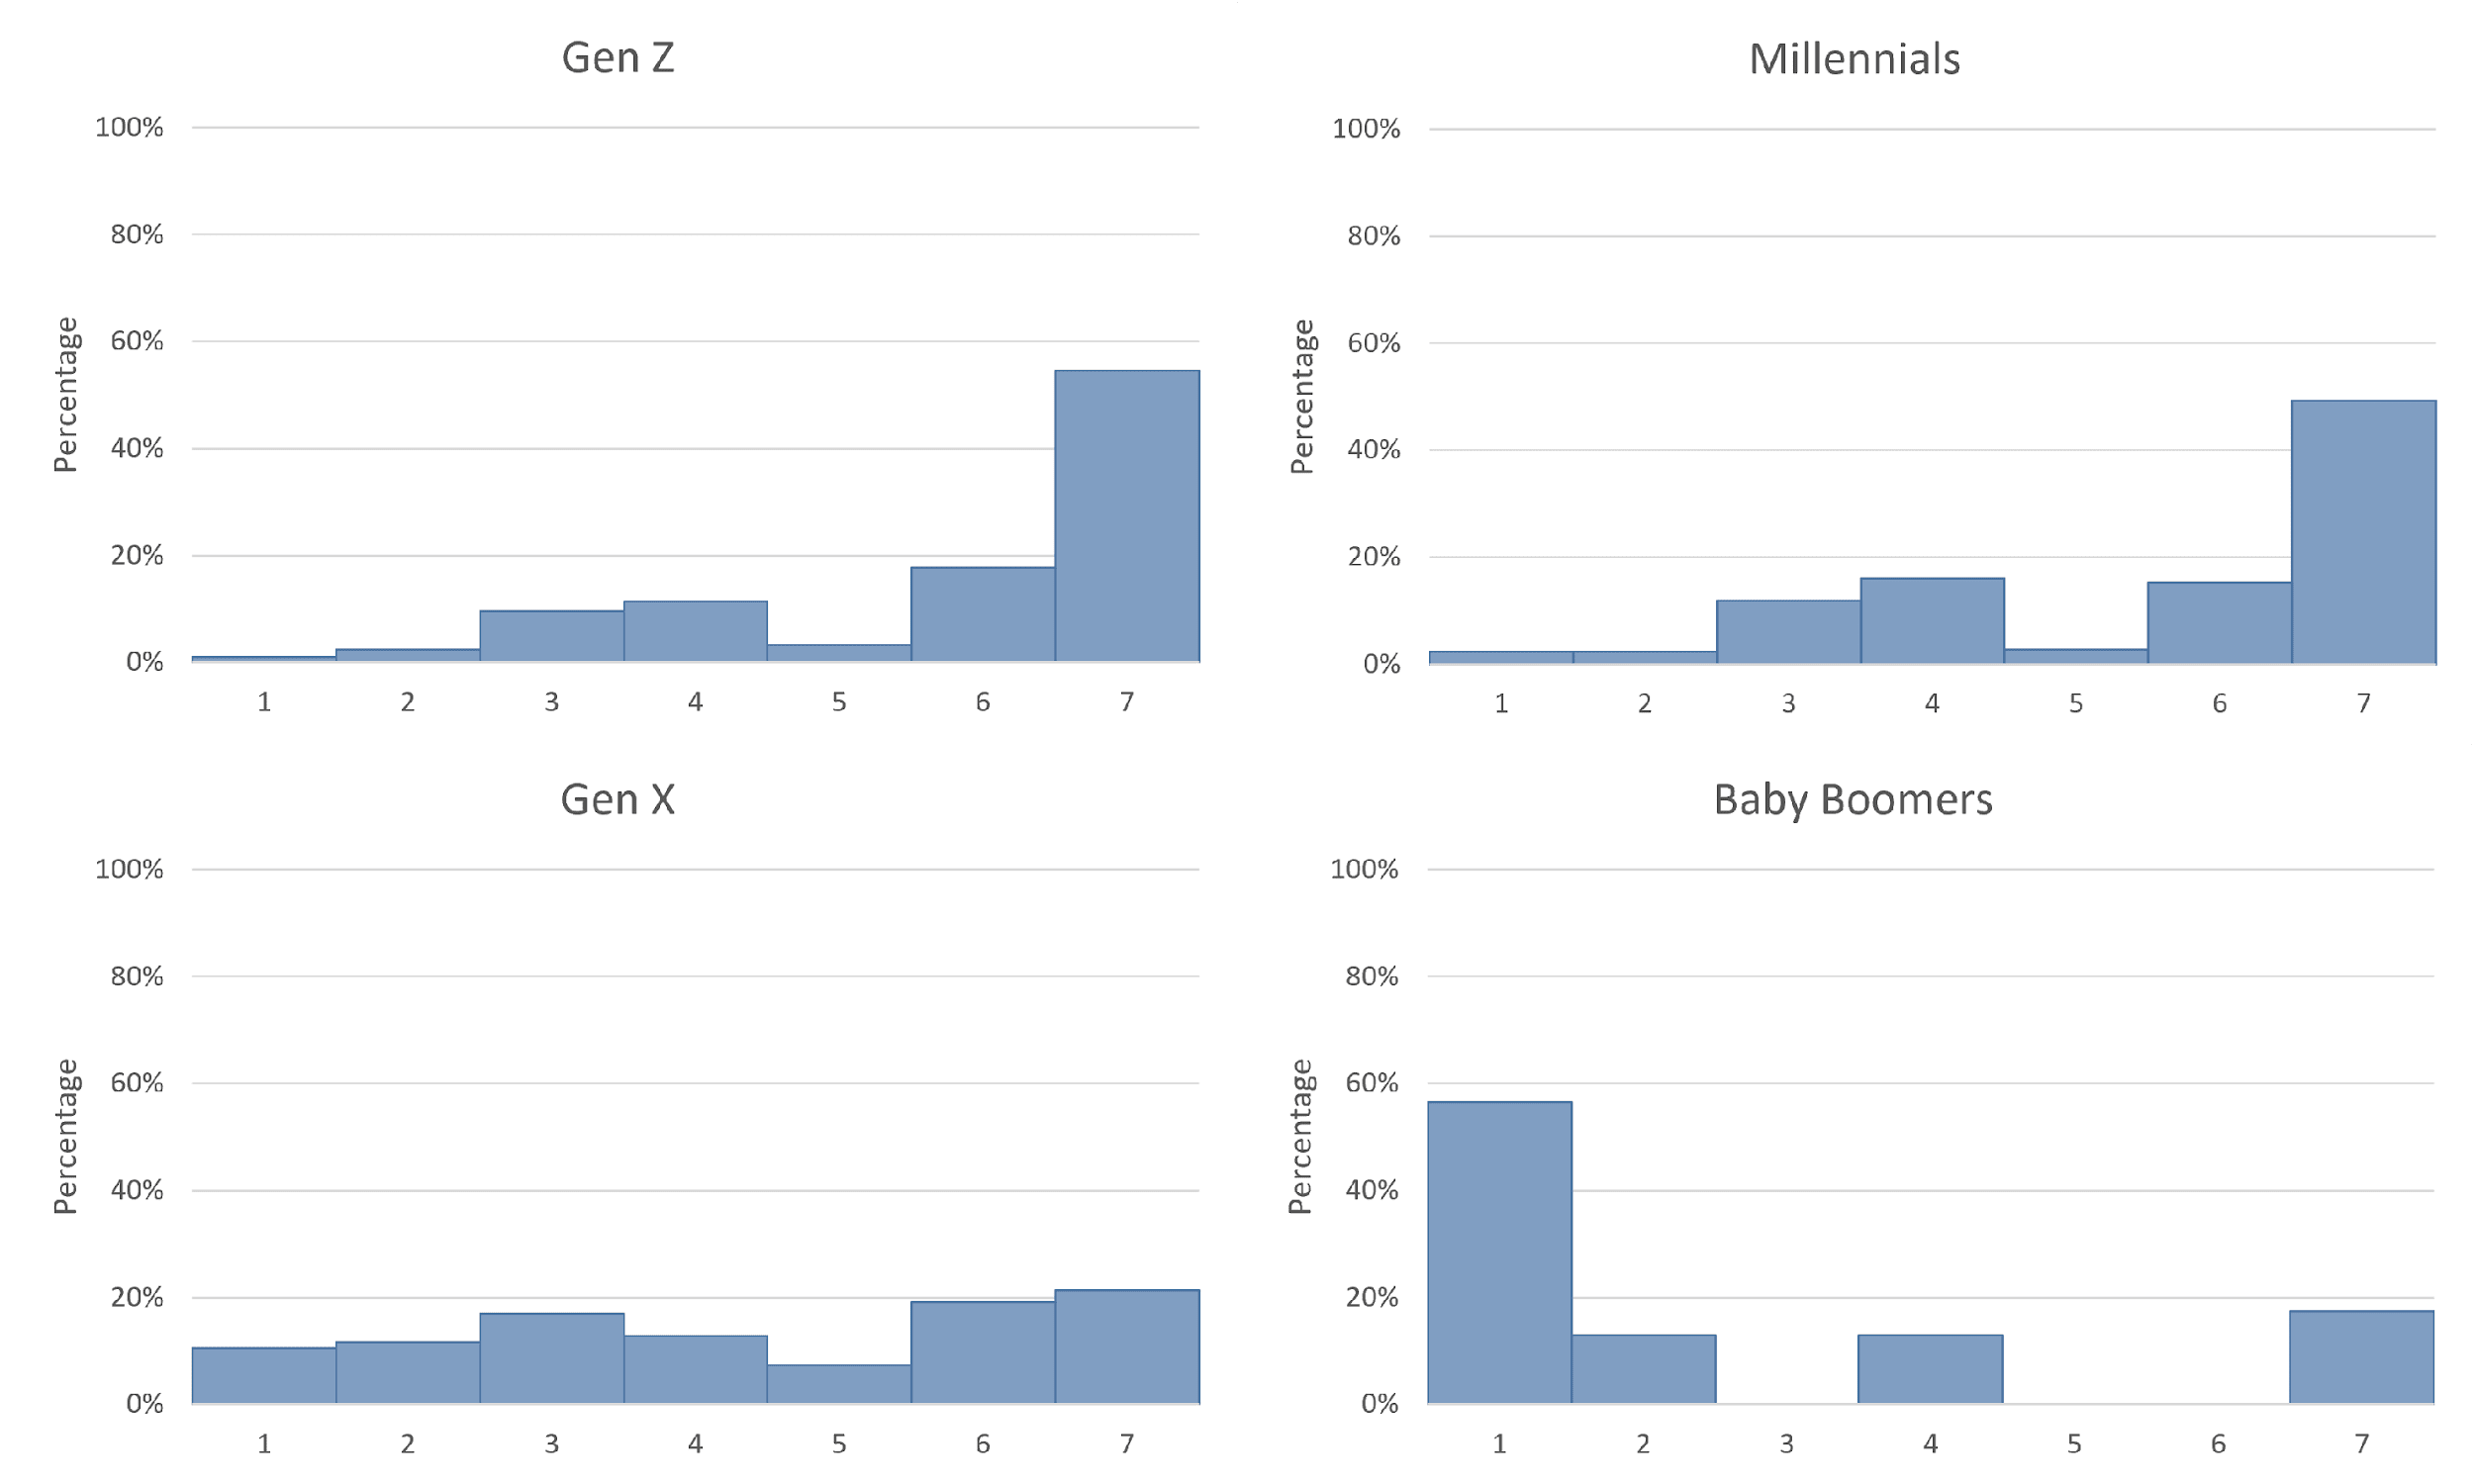
Figure 7. How often do you watch series on VOD?
There were significant differences among all age groups, except for Gen Z and millennials, who reported the highest frequency of watching series on VOD platforms (MGenZ=5.85 and Mmill=5.57). On the other hand, baby boomers had the lowest mean, indicating infrequent usage of VOD platforms (MBoomers= 2.57). These results indicate a clear shift in viewing habits towards streaming services for TV series among younger generations and a low VOD market penetration among older adults.
TV world no more for Gen Z and millennials
Interestingly, approximately one quarter of our participants stated that they do not watch TV at all. The proportion of non-viewers varied across different generations. When specifically asked about watching feature films and series on television, 27.7% of Gen Z and 29.9% of millennials responded that they do not watch TV at all. This stands in stark contrast to Gen X and baby boomers, who still heavily rely on television for their entertainment needs, with only 12.8% of Gen X and 8.7% of baby boomers indicating that they do not watch TV.
This does not mean that younger generations do not watch films and series. On the contrary, they do, but they are shifting away from traditional broadcast TV, and embracing VOD services as their primary source of entertainment. Only 2.5% of Gen Z participants and 2.7% of millennials reported not using VOD to watch feature films, while 13.8% of Gen X and a substantial 52.2% of baby boomers indicated that they do not utilise VOD services.
| Gen Z | Millennial | Gen X | Boomers | |
| I don’t watch TV | 27.7% | 29.9% | 12.8% | 8.7% |
| I don’t use VOD | 2.5% | 2.7% | 13.8% | 52.8% |
Table 6. How do you watch foreign films and series?
Overall, our findings indicate that the two youngest generations primarily rely on streaming platforms and rarely utilise traditional TV for their content consumption. In contrast, older generations, particularly baby boomers, rarely use streaming platforms to watch films or TV series.
5.3.3 AVT preferences by setting and genre
After determining how often our respondents consumed content on TV, VOD platforms, and in cinemas, our next objective was to ascertain their AVT preferences regarding each of these settings. We also delved into the variations in their preferences based on the genre of the content, specifically analysing animated and live-action productions.
AVT preferences in cinemas
When it comes to the cinema, AVT preferences varied depending on the genre. As voice-over is not used in Polish cinemas, participants only had two options to choose from: subtitling and dubbing. For live-action feature films, subtitling emerged as the most popular AVT mode, with 88% of participants selecting it, while 7.9% preferred dubbing. On the other hand, when it comes to animations, dubbing took the lead, receiving 53.6% of the votes compared to only 14.7% for subtitling.
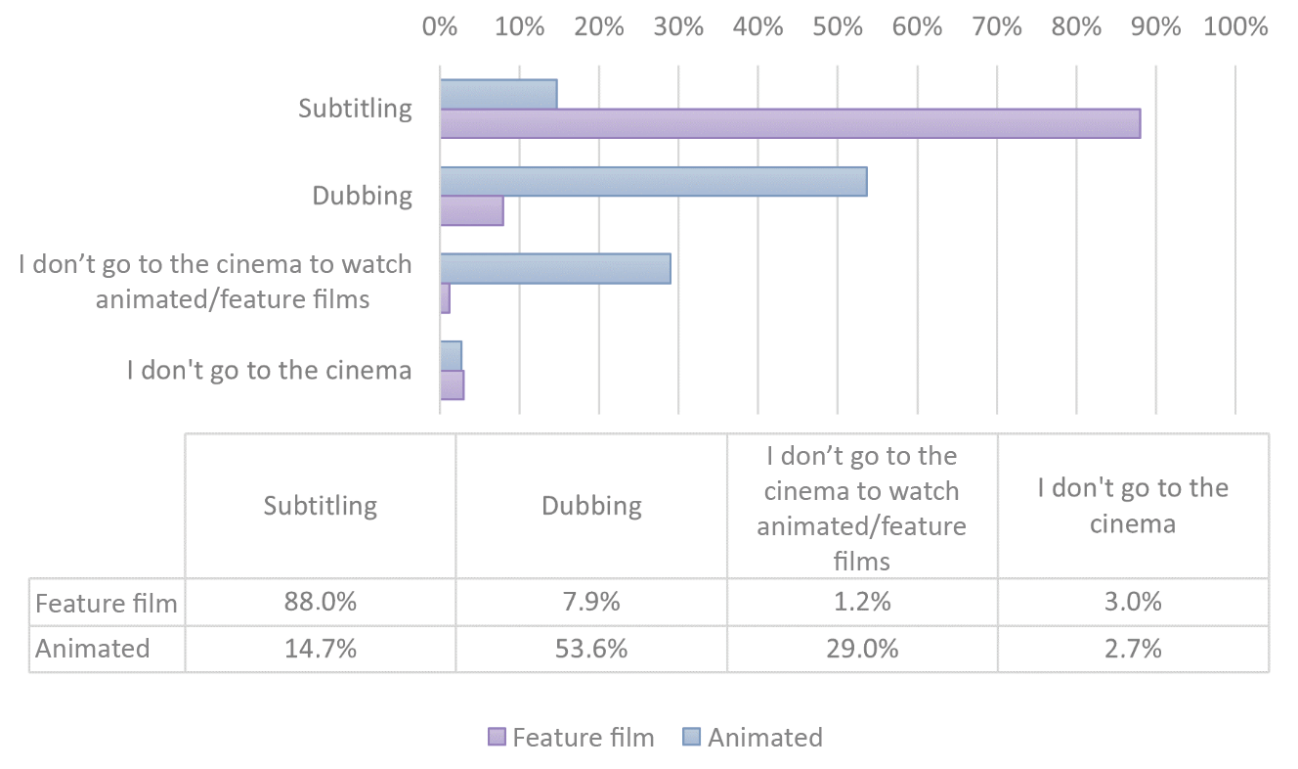
Figure 8. Preferred AVT mode in cinemas by film type
Interestingly, 29% of respondents mentioned that they do not go to the cinema to watch animated films, and 2.7% stated that they do not go to the cinema at all.
AVT preferences on television
When it comes to watching content on traditional TV, Polish viewers prefer dubbing in animations, but they favour subtitling and voice-over in non-animated feature films and TV series. For animated films and series, 36.9% of respondents indicated a preference for dubbing, while 12.4% preferred subtitling and only 6.3% chose voice-over. Additionally, 18.7% of viewers stated that they do not watch animated films on TV, and 25.7% indicated that they do not watch TV at all.
In contrast, for live-action feature films and series, subtitling was the most preferred mode (31.7%), followed by voice-over (25.4%) and dubbing (6%). Furthermore, 10.1% of respondents mentioned not watching feature films on TV, and over a quarter indicated not watching TV at all.
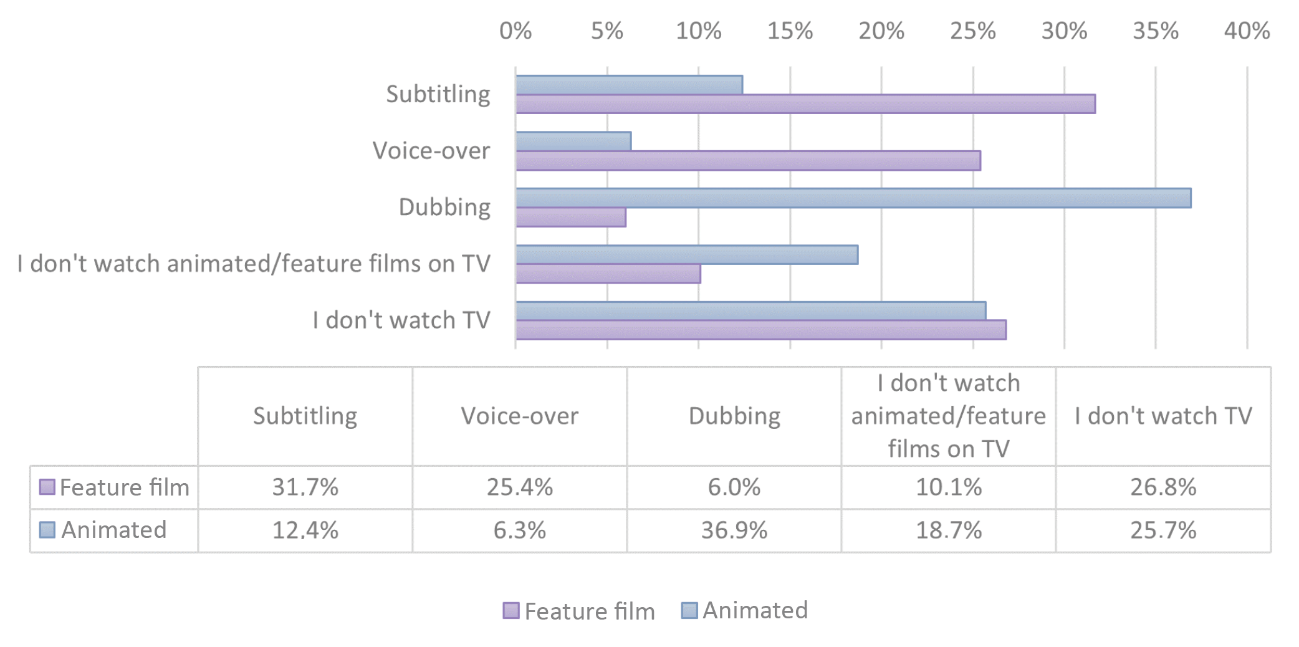
Figure 9. Preferred AVT mode in animations and feature films on TV
If we exclude people who do not watch TV, the preference for dubbing in animations becomes even more pronounced. Interestingly, the preference for dubbing in animated productions was reported by members of all generations (see Fig. 10).
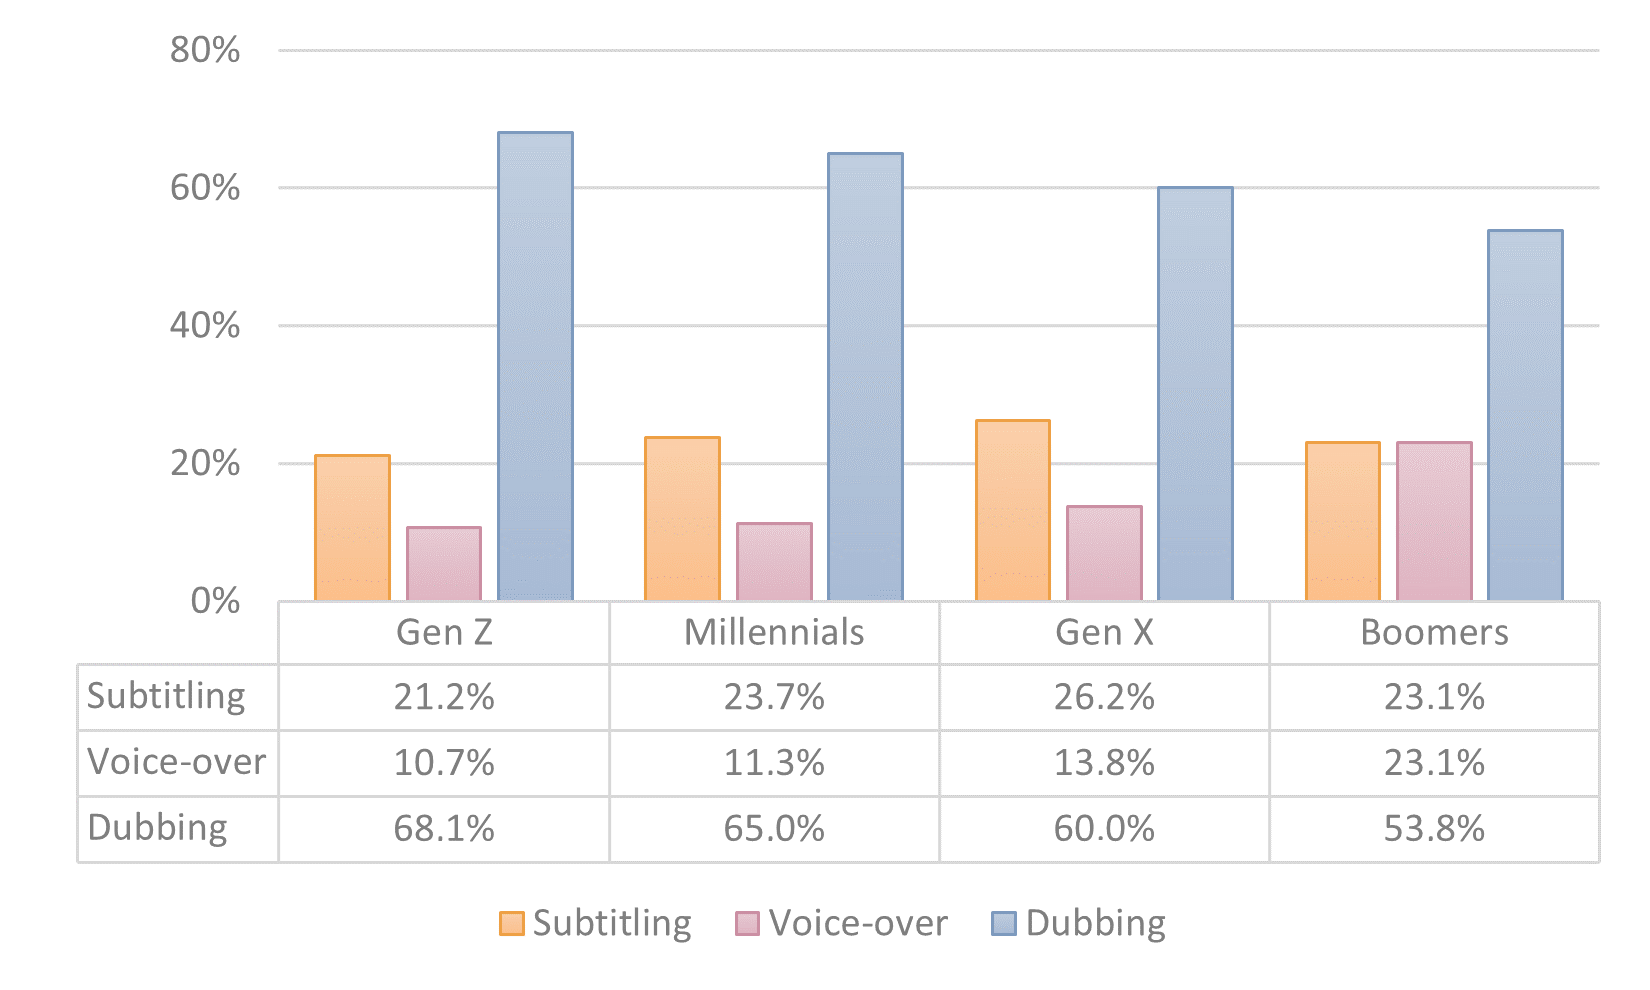
Figure 10. Preferred AVT mode in animations on TV
(excluding participants who claim not to watch (animations on)
TV)
Why Polish viewers like dubbing in animations
Insights from the open-ended question shed light on why Polish viewers tend to prefer dubbing in animated films, particularly those targeted at children. Numerous viewers praised the high quality of Polish dubbing in animations, often opting for this mode of translation as a result:
“Usually the quality of Polish dubbing in animations is of such a high level that I can choose this mode of translation. The general rule in my case is: animations with dubbing, everything else in the original with Polish or English subtitles”;
“I most like to watch animated films for children with dubbing because I think it is the only case in which Polish dubbing can sometimes be better than the original language”;
“I really like Polish dubbing for films and animated series because, in most cases, it is very good”.
Nostalgia also played a significant role, with viewers associating dubbing with childhood memories and a sense of familiarity:
“I watch animations with dubbing if it’s voiced by actors I really like or if it is a classic. I am used to and have a fondness for Shrek, Finding Nemo, the first part of Harry Potter, etc.)”;
“I only watch animations with dubbing, mostly to sing along in Polish. It’s like a return to childhood”.
Moreover, this nostalgic element extended beyond animated films to other content consumed during respondents’ childhood, such as live-action films like the Harry Potter series: “There are live-action films that I prefer with dubbing because of nostalgia (e.g., Harry Potter)”.
AVT preferences on VOD
Finally, when it comes to watching content on streaming platforms, our participants favoured subtitling for all types of content, both animated and non-animated films and series. Still, their overall preference for dubbing was quite high for animations and amounted to 31% compared to 46% for subtitling and only 4.6% for voice-over.
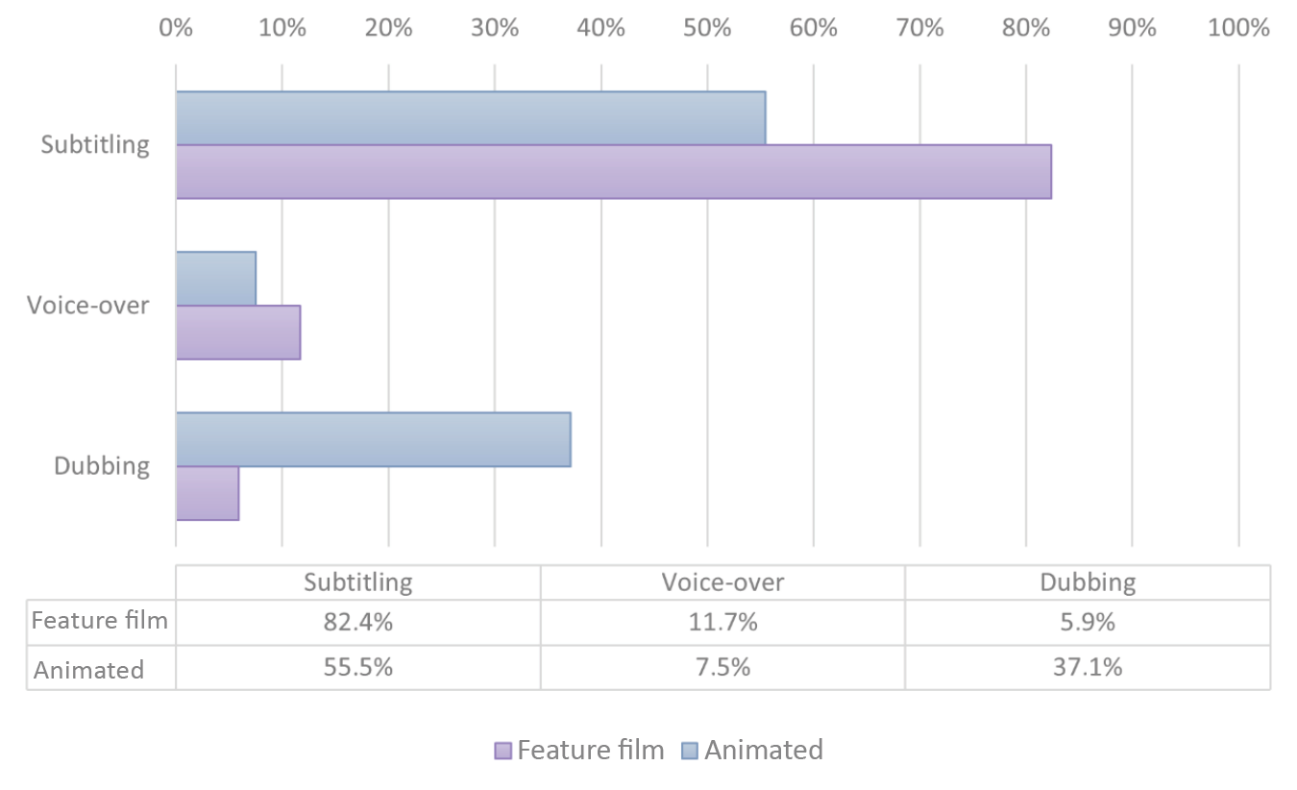
Figure 11. Preferences for VOD (only people watching/using VOD)
In conclusion, our study findings indicate that Polish viewers have a preference for subtitling when it comes to live-action feature films and series. However, for animations, they show a preference for dubbing on TV and in cinemas, but not on VOD platforms, where they prefer subtitling.
5.4 Discussion
By conducting this study, we aimed to explore the AVT preferences of viewers from different generations in Poland, focusing on animated and non-animated content across multiple platforms such as TV, cinemas, and VOD services. Our objective was to gain insights into how recent technological advancements have influenced the way people, particularly young viewers, engage with audiovisual content.
First and foremost, our findings indicate a departure from Poland’s previous status as a predominantly voice-over country. The majority of our respondents expressed a preference for subtitling over voice-over. AVT preferences were found to be influenced by various factors, such as generational affiliation, setting (TV, VOD or cinema) and the type of production (animated vs. live-action). When it comes to age, subtitling emerged as the preferred mode across all respondent groups. The youngest generations (Gen Zs and millennials) overwhelmingly expressed a preference for subtitling. Dubbing, on the other hand, was quite popular among baby boomers, possibly influenced by their recollection of excellent Polish dubbing during the 1960s and 1970s. The Gen X group showed a more divided preference, with a nearly equal number favouring voice-over and subtitling. Furthermore, the analysis of AVT preferences by education revealed that participants with secondary or vocational education were less likely to prefer subtitling, while students tended to favour subtitling over voice-over or dubbing. Additionally, AVT preferences varied based on the participants’ place of residence, with individuals from rural areas and small towns leaning towards dubbing, while respondents from larger cities showed a tendency to prefer subtitling.
Our findings also showed that AVT preferences for animated and live-action productions vary across different viewing settings. In cinemas, subtitling is the preferred mode for live-action films, while dubbing takes the lead for animated films. On traditional TV, Polish viewers prefer dubbing for animated productions and mainly opt for subtitling for live-action feature films and TV series. On streaming platforms, subtitling emerges as the favoured mode for both animated and non-animated content, although there is still a considerable preference for dubbing in animations.
An important factor that may influence AVT preferences, particularly when it comes to dubbing, is nostalgia or a bias towards the first viewing experience. Despite the overall aversion to dubbing in live-action feature films and TV series, our survey revealed that animated productions and childhood films are exceptions to this trend. In response to the open-ended question, many participants mentioned that while they generally prefer subtitling, they have a special fondness for certain dubbed films, such as the Polish-dubbed version of Shrek (which has attained cult classic status), old Disney films, Asterix and Obelix, and early Harry Potter films that they first watched in a dubbed format. Although some of these examples are not animated productions, nostalgia makes dubbing acceptable in these cases because it is likely the version they were introduced to during their childhood.
Furthermore, our study also provides a more nuanced understanding of AVT preferences compared to the existing literature, where viewers’ choices are primarily associated with the country of residence (Chaume, 2012; Gottlieb, 1998). Our respondents indicated that their AVT preferences are also influenced by personal factors and viewing circumstances. Personal preferences can include using subtitles to learn foreign languages, choosing voice-over as background noise during household tasks, or even muting the audio and relying on captions when there is a sleeping baby nearby. Many participants mentioned that their choice of AVT mode depends on how, why, and with whom they are consuming their entertainment. For example, they may opt for voice-over when watching something with older family members who find subtitles challenging to read. Overall, as noted by Díaz-Cintas and Hayes (2023, p. 4), “preferences can be very subjective and differ between viewers on an individual level rather than national level, which […] makes it very difficult to continue to distinguish nowadays between dubbing and subtitling countries as has been done in the past”.
An important finding of our study is the growing trend among younger generations, such as Gen Z and millennials, to reject cable and broadcast TV in favour of VOD platforms. A considerable number of young individuals reported that they do not own a TV set or subscribe to traditional TV services. Instead, they rely increasingly on streaming services as the primary source of their media entertainment. This trend is not limited to Poland alone but is observed among the younger demographic in other countries as well. Nielsen Research Centre reported that in 2022 streaming viewership surpassed broadcast and cable TV figures, becoming the top choice for viewers in the US. Experts predict that “linear TV is nearing its end” (Forristal, 2022), and the Washington Post announced that “streaming TV is having an existential crisis” (Andrews, 2022). According to Reed Hastings, the founder of Netflix, “Looking forward, streaming is working everywhere. Everyone is pouring in. It’s the end of linear TV over the next five, ten years” (Forristal, 2022). In conclusion, the shift towards streaming services as the preferred mode of media consumption is not unique to Polish viewers, but rather reflects a larger global trend, with younger generations increasingly turning away from traditional TV in favour of VOD platforms.
Before drawing conclusions, we must acknowledge a significant limitation of our study, namely the bias towards younger generations. This limitation stems from the online nature of our study, which excluded many older individuals from participating. However, this limitation can also be viewed as an advantage, as it allowed us to capture evolving AVT preferences among a large sample of young viewers. While our findings may not be representative of the entire population, they provide valuable insights into emerging trends and changing AVT preferences among younger generations.
6. Conclusion
In contrast to previous opinion polls conducted before the rise of video-on-demand streaming platforms, our study revealed a departure from the preference for voice-over among Polish viewers. We also observed that young viewers in Poland are increasingly opting for VOD platforms over paid TV services and generally show a preference for subtitling over other audiovisual translation modes, including voice-over. Interestingly, we saw a notable exception to the overall aversion to dubbing reported in the study when it comes to animated productions, especially those that respondents watched during their childhood.
However, we do not intend for this study to impose rigid categorisations by labelling Poland solely as a “voice-over stronghold” or strictly as a subtitling country. The data presented in this paper indeed indicate a shift in viewers’ habits and preferences. More importantly, they highlight the significance of choice. For years, Polish audiences were limited to voice-over as the sole available AVT mode for (analogue) TV. Once presented with alternative options, their preferences evolved. What is more, viewers do not restrict themselves to a single method of audiovisual translation. Even proponents of subtitling mentioned that they occasionally opt for voice-over when engaged in activities like knitting, doing laundry, or feeling fatigued. Additionally, many viewers choose voice-over when consuming content with older family members who may be less comfortable with following subtitles compared to their younger counterparts. This demonstrates that not only the content itself, but also the AVT mode may serve different purposes. Therefore, we hope that instead of hastily hailing Poland as the newest subtitling country based on the new trends, both researchers and industry professionals will start to view Poland (and possibly any other country) as a place of choice, particularly concerning AVT modes in streaming services. This phenomenon is aptly captured in the following quote from Chaume (2012):
The AVT landscape is no longer black and white. The distinction between dubbing and subtitling countries has become blurred. Former dubbing countries now have significant subtitling industries and have witnessed the growth of their voice-over market. In turn, audiences in former subtitling countries are becoming more used to dubbing and former voice-over countries are moving towards dubbing and subtitling. The important question for audiences is that the single option of either dubbing or subtitling or voice-over should give way to a variety of audiovisual texts that might be dubbed, subtitled, voiced-over, subtitled for the deaf, or audio described for the blind. The more options we have, the better for the consolidation of a freer, multilingual, and diverse audience (p. 7).
More than ten years later, Chaume’s quote still rings poignantly true. We hope that our study offers a glimpse into the rapidly changing landscape of viewers’ preferences and that they will, at least to some extent, show that all AVT modes, even the ones (okay, one - voice-over, we are looking at you) deemed inferior, serve a purpose. Although we fear that some decision makers may look at the global trends and decide to limit the production of revoicing modes in favour of (much cheaper) subtitling, we wish for this paper to be a voice for choice.
References
Andrews, T. (2022, September 7). Streaming TV is having an existential crisis, and viewers can tell. The Washington Post.
https://www.washingtonpost.com/arts-entertainment/2022/09/07/streaming-tv-changes-crisis/
Bogucki, Ł. (2004). The constraint of relevance in subtitling. The Journal of Specialised Translation, 1, 71–88.
Bogucki, Ł.& Deckert, M. (2018). Badanie Preferencji Dotyczących Przekładu Audiowizualnego Wśród Polskich Widzów. In P. P. Chruszczewski & A. R. Knapik (Eds.), Między tekstem a kulturą: Z zagadnień przekładoznawstwa (pp. 252–67). Æ Academic.
https://doi.org/10.52769/BL1.0014.lbog-mdec
Braun, V. & Clarke, V. (2006). Using thematic analysis in psychology. Qualitative Research in Psychology 3(2): 77–101. https://doi.org/10.1191/1478088706qp063oa
Chaume, F. (2012). Audiovisual translation: Dubbing. Translation practices explained. St. Jerome Publishing.
Danan, M. (1991). Dubbing as an expression of nationalism. Meta, 36(4), 606–14. https://doi.org/10.7202/002446ar
Díaz‐Cintas, J. (1999). Dubbing or subtitling: The eternal dilemma. Perspectives, 7(1), 31–40. https://doi.org/10.1080/0907676X.1999.9961346
Díaz-Cintas, J. & Hayes, L. (2023). Role reversal: An overview of audiovisual translation into English. Íkala, Revista de Lenguaje y Cultura, 28(2), 1–18. https://doi.org/10.17533/udea.ikala.v28n2a01
Dolny, Z. (2009, November 8). Z Prehistorii Polskiego Dubbingu – Rok 1931. Polski-Dubbing.pl. http://www.polski-dubbing.pl/forum/viewtopic.php?f=10&t=399
Dreier, T. (2019, May 20). 80% of Video Caption Users Aren’t Hearing Impaired, Finds Verizon. Streaming Media. https://www.streamingmedia.com/Articles/ReadArticle.aspx?ArticleID=131860
Flis, G., Sikorski, A. & Szarkowska, A. (2020). The dubbing effect: An eye-tracking study on how viewers make dubbing work. The Journal of Specialised Translation, 33, 41–69.
Flis, G., & Szarkowska, A. (2024). AVT preferences in Poland. [Data set]. https://doi.org/10.17605/OSF.IO/2EPR5
Forristal, L. (2022, August 18). Streaming viewership surpassed cable TV for the first time, says Nielsen. https://techcrunch.com/2022/08/18/streaming-viewership-surpassed-cable-tv-for-the-first-time-says-nielsen/
Garcarz, M. (2007). Przekład slangu w filmie: telewizyjne przekłady filmów amerykańskich na język polski. Tertium.
Gottlieb, H. (1998). Subtitling. In M. Baker (Ed.), Routledge encyclopaedia of translation studies. Routledge.
Jankowska, A. (2019). Accessibility mainstreaming and beyond – senior citizens as secondary users of audio subtitles in cinemas. International Journal of Language, Translation and Intercultural Communication, 8, 28-47. https://doi.org/10.12681/ijltic.20275
Mijas, H. (2016). Women of the Polish school of dubbing. Studia Filologiczne, 29, 251–65.
Patel, S. (2016, May 17). 85 Percent of Facebook Video Is Watched without Sound. Digiday. https://digiday.com/media/silent-world-facebook-video/
Pérez-González, L. (2018). Rewiring the circuitry of audiovisual translation. In L. Pérez-González (Ed.), The Routledge handbook of audiovisual translation, (pp. 1–12). Routledge. https://doi.org/10.4324/9781315717166-1
Plewa, E. (2015). Układy Translacji Audiowizualnych. Wydawnictwo Naukowe Instytutu Komunikacji Specjalistycznej i Interkulturowej Uniwersytet Warszawski.
Szarkowska, A. (2009). The audiovisual landscape in Poland at the dawn of the 21st century. In A. Goldstein and B. Golubović (Eds.), Foreign language movies – dubbing vs. subtitling. Schriften zur Medienwissenschaft, (pp. 185-201). Verlag Dr. Kovač.
Szarkowska, A., & Laskowska, M. (2015). Poland – a voice-over country no more? A report on an online survey on subtitling preferences among Polish hearing and hearing-impaired viewers. In Ł. Bogucki and M. Deckert (Eds.), Accessing audiovisual translation (pp. 179–198). Peter Lang.
Szkriba, S. (2022). Accessible cinema for older adults: Can an app for blind viewers benefit the sighted population? Journal of Audiovisual Translation, 5(2), 134-151. https://doi.org/10.47476/jat.v5i2.2022.221
Youngs, I. (2021, November 15). Young viewers prefer TV subtitles, research suggests. BBC. https://www.bbc.com/news/entertainment-arts-59259964
Zajechowski, M. (2022, June 17). Survey: Why America is obsessed with subtitles. Preply. https://preply.com/en/blog/americas-subtitles-use/.
Data Availability Statement
The data that support the findings of this study are openly available in the OSF data repository at http://doi.org/10.17605/OSF.IO/2EPR5.
Funding
This study was conducted as part of the project "Dubbing is in the Eye of the Beholder", funded by the Polish Ministry of Science and Higher Education under the Diamond Grant Programme (grant no. DI2019 001149) for the years 2020–2024.
Notes
ORCID: 0000-0003-3953-8708; e-mail: gk.flis@uw.edu.pl
ORCID 0000-0002-0048-993X; e-mail: a.szarkowska@uw.edu.pl
In this context, we differentiate between captions as an accessibility solution for deaf and hard of hearing and subtitling as an AVT mode.↩︎
This phenomenon is better explained by a video published by Vox, which dives into the topic of how dialogues are recorded and processed nowadays Why we all need subtitles now.↩︎
All open-ended responses from the questionnaire cited in this paper were translated into English by the first author.↩︎